PROTEIN SEQUENCING
In 1953, Frederick Sanger of Cambridge University in England reported the amino acid sequences of the two polypeptide chains composing the protein insulin. Not only was this a remarkable achievement in analytical chemistry but it helped to demystify speculation about the chemical nature of proteins. Sanger’s results clearly established that all of the molecules of a given protein have a fixed amino acid composition, a defined amino acid sequence, and therefore an invariant molecular weight. In short, proteins are well defined chemically. Today, the amino acid sequences of some 100,000 different proteins are known. Although many sequences have been determined from application of the principles first established by Sanger, most are now deduced from knowledge of the nucleotide sequence of the gene that encodes the protein.
Protein Sequencing Strategy
The usual strategy for determining the amino acid sequence of a protein involves eight basic steps:
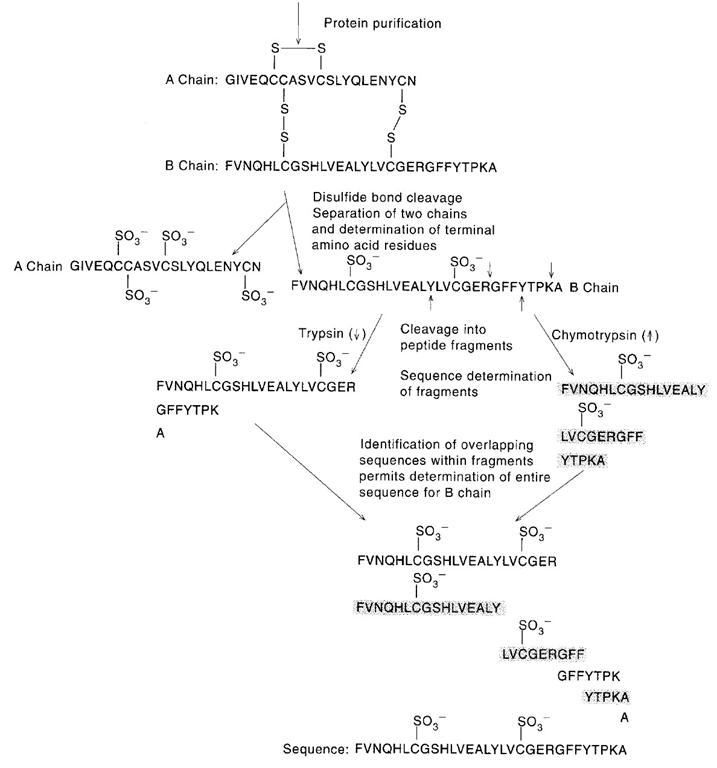
1. If the protein contains more than one polypeptide chain, the chains are separated and purified.
2. Intrachain S--S (disulfide) cross-bridges between cysteine residues in the polypeptide chain are cleaved. If these disulfides are interchain linkages, then step 2 precedes step1.
3. The amino acid composition of each polypeptide chain is determined.
4. The N-terminal and C-terminal residues are identified.
5. Each polypeptide chain is cleaved into smaller fragments.
6. Sequence determination of peptide fragments.
7. The overall amino acid sequence of the protein is reconstructed from the sequences in overlapping fragments.
8. The positions of S--S cross-bridges formed between cysteine residues are located.
Each of these steps is discussed in greater detail in the following sections.
Step 1: Separation of Polypeptide Chains:
If the protein of interest is a heteromultimer (composed of more than one type of polypeptide chain), then the protein must be dissociated and its component polypeptide subunits must be separated from one another and sequenced individually. Subunit associations in multimeric proteins are typically maintained solely by noncovalent forces, and therefore most multimeric proteins can usually be dissociated by exposure to pH extremes, 8 M urea, 6 M guanidinium hydrochloride, or high salt concentrations. (All of these treatments disrupt polar interactions such as hydrogen bonds both within the protein molecule and between the protein and the aqueous solvent.) Once dissociated, the individual polypeptides can be isolated from one another on the basis of differences in size and/or charge. Occasionally, heteromultimers are linked together by interchain S--S bridges. In such instances, these cross-links must be cleaved prior to dissociation and isolation of the individual chains. The methods described under step 2 are applicable for this purpose.
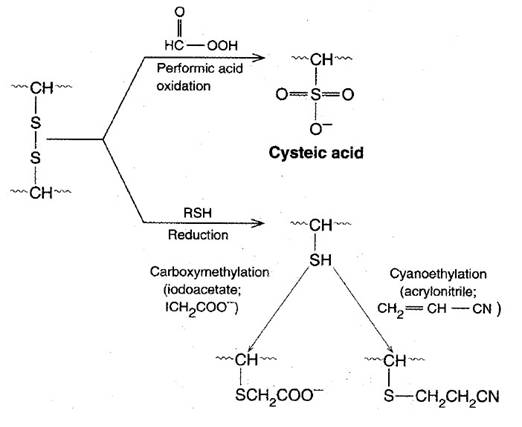
Step 2: Cleavage of Disulfide Bridges
A number of methods exist for cleaving disulfides. An important consideration is to carry out these cleavages so that the original or even new S--S links do not form. Oxidation of a disulfide by performic acid results in the formation of two equivalents of cysteic acid. Because these cysteic acid side chains are ionized SO3 groups, electrostatic repulsion (as well as altered chemistry) prevents S--S recombination. Alternatively, sulfhydryl compounds such as 2-mercaptoethanol readily reduce S--S bridges to regenerate two cysteine-SH side chains. However, these SH groups recombine to re-form either the original disulfide link or, if other free Cys-SHs are available, new disulfide links. To prevent this, SOS reduction must be followed by treatment with alkylating agents such as iodoacetate or 3-bromopropylamine, which modify the SH groups and block disulfide bridge formation.
Step 3: Analysis of Amino Acid Composition
Amino acid composition of polypeptide chain is determined using amino acid analyzer. The amino acid analyzer consists of ion-exchange column through which the appropriate elution buffer is pumped after the amino acids are introduced at the top of the column with the help of digested sample and buffer. As the separated amino acid emerge, they are mixed with ninhydrin solution and passed through heated coil of tubing to allow the formation of the colored ninhydrin product. The separated ninhydrin color products then pass through a cell that measures the optical absorbance at 540 and 440 nm and plots the results on a strip-chart recorder. The absorbance is measured at two wavelengths because proline, which is substituted at its amino group, forms a different ninhydrin color product with an absorption maximum that is correspondingly different from that pf the remaining amino acids.
Usually the amino acid analyzer is first standardized by running through it a sample containing known quantities of amino acids to account for any differences in their ninhydrin reaction properties. In this way it is possible to relate directly the amount amino acid present to the amount of colored product formed, as measured by the area under peak produced on the strip chart recorder. Similarly, the amino acid hydrolysate of a protein of unknown composition can be run through the analyzer and relative peak areas can be used to estimate the ratios of different amino acids present.
Step 4: Identification of the N- and C-Terminal Residues
End-group analysis reveals several things. First, it identifies the N- and C-terminal residues in the polypeptide chain. Second, it can be a clue to the number of ends in the protein. That is, if the protein consists of two or more different polypeptide chains, then more than one end group may be discovered, alerting the investigator to the presence of multiple polypeptides.
N-Terminal analysis:
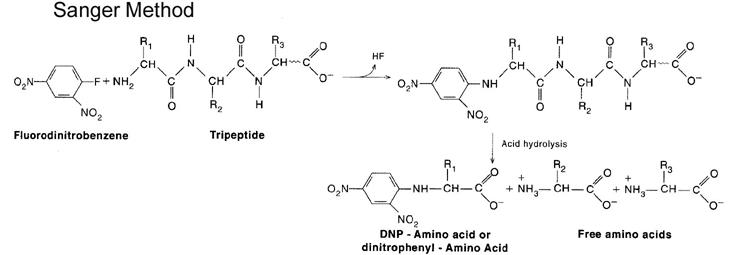
Amino terminal end of polypeptide chain determined by either of three methods namely sangar method, Edmann’s method and dansyl chloride method. In sanger method, Fluorodinitrobenzene used. Polypeptide reacts with FDNB to form Dinitrophenol complex with polypeptide. Subsequent analysis releases a colored dinitrophenol labeled amino terminal amino acid, which can be identified by its characteristic migration rate on thin-layer chromatography or paper electrophoresis. In Edman degradation method, Phenyl isothio cyanate (PIT) is used as reagent. First the polypeptide is rected with phenyl isothio cyanate to forma polypeptidyl phenylthiocarbamyl derivative. Gentle hydrolysis releases the amino terminal amino acid as a phenylthiohydantoin (PTH), which can be separated and detected spectrophotometrically. Upto this stage, this method is used to determine N-terminal aminoacid. This method can also be extended to determine polypeptide sequence. For this, after the release of PTH, the remaining intact polypeptide, shortened by one amino acid, is then ready for further cycles of this procedure. Dansyl chloride is also used to determine N-terminal amino acid. This method is more sensitive because of fluorescence measurement.
C- Terminal Analysis:
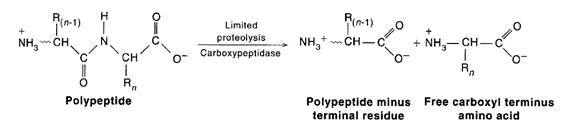
There are two methods used for C-terminal determination. They are Hydrazine method and carboxy peptidase method. Chemical methods for carboxy end-group determination are considerably less satisfactory. Treatment of the peptide with anhydrous hydrazine at 100*C results in conversion of all the amino acid resiudes to amino acid hydrazides except for the carboxy-terminal residue, which remains as the free amino acid and can be isolated and identified chromatographically. Alternatively, polypeptide can be subjected to limited breakdown with the enzyme carboxypeptidase. Carboxypeptidases are enzymes that cleave amino acid residues from the C-termini of polypeptides in a successive fashion. Four carboxypeptidases are in general use: A, B, C, and Y. Carboxypeptidase A (from bovine pancreas) works well in hydrolyzing the Cterminal peptide bond of all residues except proline, arginine, and lysine. The analogous enzyme from hog pancreas, carboxypeptidase B, is effective only when Arg or Lys are the C-terminal residues. Thus, a mixture of carboxypeptidases A and B liberates any C-terminal amino acid except proline. Carboxypeptidase C from citrus leaves and carboxypeptidase Y from yeast act on any C-terminal residue. Because the nature of the amino acid residue at the end often determines the rate at which it is cleaved and because these enzymes remove residues successively, care must be taken in interpreting results. Carboxypeptidase Y cleavage has been adapted to an automated protocol analogous to that used in Edman sequenators.
Step- 5: Fragmentation of the Polypeptide Chain
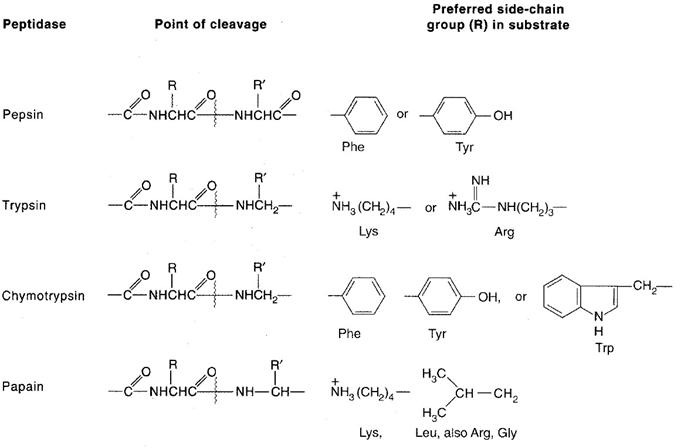
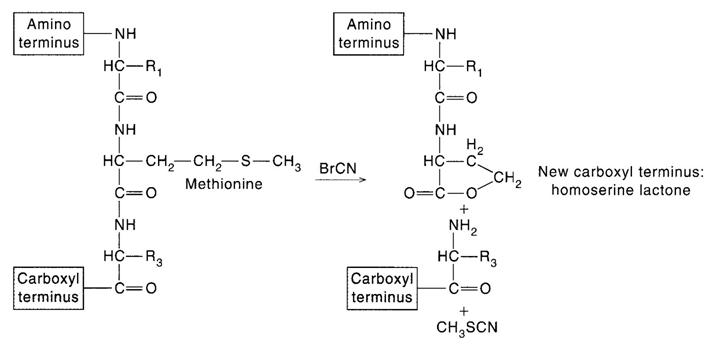
The aim at this step is to produce fragments useful for sequence analysis. The cleavage methods employed are usually enzymatic, but proteins can also be fragmented by specific or nonspecific chemical means (such as partial acid hydrolysis). Fragmentation can be achieved by the use of endopeptidases, which are enzymes that catalyze polypeptide chain cleavage at specific sites in the protein. The specificity of four endopeptidases commonly for this purpose are Pepsin, Trypsin, Chymotrypsin and Papain. Another specific chemical method for polypeptide chain cleavage involves reaction with cyanogens bromide. This reaction cleaves specifically at the methionine residues, with the accompanying conversion of free carboxyl-terminal methionine to homoserine lactone. For sequencing protein minimum two proteolytic factors should be selected and two sets of fragements should be prepared.
Step 6: Sequencing Peptide fragments
Peptides resulting from cleavage of the intact protein are generally separated by column chromatography. The isolated peptides may then be analyzed to determine their sequence. There two methods recently used for this purpose, they are Edman degradation and tandem mass spectrometer. Devices called sequenators are available that automate Edman degradation procedure. The success of these devices depends in large part on the technical innovation of covalently linking the peptide to be sequenced to glass beads. Attachment of peptide through its carboxy-terminal group to this immobile phase facilitates the complete removal of potentially conataminating reaction procedure during successive stages of the degradation. Thus with the help of this sequenators, peptide fragements are sequenced.
The other method used for protein sequencing is tandem mass spectrometer. Tandem MS (or MS/MS) allows sequencing of proteins by hooking two mass spectrometers in tandem. The first mass spectrometer is used to separate oligopeptides from a protein digest and then to select in turn each of these oligopeptides for further analysis. A selected ionized oligopeptide is directed toward the second mass spectrometer; on the way, this oligopeptide is fragmented by collision with helium or argon gas molecules, and the collection of fragments is analyzed by the second mass spectrometer. Fragmentation occurs primarily in the peptide bonds linking successive amino acids in the oligopeptide, so the fragments created represent a nested set of peptides that differ in size by one amino acid residue. The fragments differ in mass by 56 atomic mass units (the mass of the peptide backbone atoms (NH-CH-CO)) plus the mass of the R group at each position, which ranges from 1 atomic mass unit (Gly) to 130 (Trp). MS sequencing has the advantages of very high sensitivity, fast sample processing, and the ability to work with mixtures of proteins. Subpicomoles (less than 10_12 moles) of peptide can be analyzed. However, in practice, tandem MS is limited to rather short sequences (no longer than 15 or so amino acid residues).
Step 7: Reconstruction of the Overall Amino Acid Sequence
The sequences obtained for the sets of fragments derived from two or more cleavage procedures are now compared, with the objective being to find overlaps that establish continuity of the overall amino acid sequence of the polypeptide chain. Peptides generated from specific hydrolysis of the polypeptide can be aligned to reveal the overall amino acid sequence. Such comparisons are also useful in eliminating errors and validating the accuracy of the sequences determined for the individual fragments.
Step 8: Location of Disulfide Cross-Bridges
Strictly speaking, the disulfide bonds formed between cysteine residues in a protein are not a part of its primary structure. Nevertheless, information about their location can be obtained by procedures used in sequencing, provided the disulfides are not broken prior to cleaving the polypeptide chain. Because these covalent bonds are stable under most conditions used in the cleavage of polypeptides, intact disulfides link the peptide fragments containing their specific cysteinyl residues and thus these linked fragments can be isolated and identified within the protein digest. An effective way to isolate these fragments is through diagonal electrophoresis.
A protein digest in which any disulfide bonds remain intact and link their respective Cys-containing peptides is streaked along the edge of a filter paper and subjected to electrophoresis. A strip cut from the edge of the paper is then exposed to performic acid fumes to oxidize any disulfide bridges. Then the paper strip is attached to a new filter paper so that a second electrophoresis can be run in a direction perpendicular to the first. Peptides devoid of disulfides experience no mobility change, and thus their pattern of migration defines a diagonal. Peptides that had disulfides migrate off this diagonal and can be easily identified, isolated, and sequenced to reveal the location of cysteic acid residues formerly involved in disulfide bridges. From this information, the positions of the disulfides in the protein can be stipulated.
MASS SPECTROMETER:
Mass spectrometry (also known as mass spectroscopy informally, "mass-spec" and MS) is an analytical technique used to measure the mass-to-charge ratio of ions. It is most generally used to find the composition of a physical sample by generating a mass spectrum representing the masses of sample components. The mass spectrum is measured by a mass spectrometer.
For large samples such as biomolecules, molecular masses can be measured to within an accuracy of 0.01% of the total molecular mass of the sample i.e. within a 4 Daltons (Da) or atomic mass units (amu) error for a sample of 40,000 Da. This is sufficient to allow minor mass changes to be detected, e.g. the substitution of one amino acid for another, or a post-translational modification. For small organic molecules the molecular mass can be measured to within an accuracy of 5 ppm or less, which is often sufficient to confirm the molecular formula of a compound, and is also a standard requirement for publication in a chemical journal. Structural information can be generated using certain types of mass spectrometers, usually those with multiple analysers which are known as tandem mass spectrometers. This is achieved by fragmenting the sample inside the instrument and analysing the products generated. This procedure is useful for the structural elucidation of organic compounds and for peptide or oligonucleotide sequencing.
APPLICATIONS:
Accurate molecular weight measurements:
Sample confirmation, to determine the purity of a sample, to verify
amino acid substitutions, to detect post-translational modifications, to
calculate the number of disulphide bridges.
Reaction monitoring:
To monitor enzyme reactions, chemical modification and protein digestion.
Amino acid sequencing:
Sequence confirmation, de novo characterisation of peptides,
identification of proteins by database searching with a sequence "tag" from a
proteolytic fragment.
Oligonucleotide sequencing:
The characterisation or quality control of oligonucleotides
Protein structure:
Protein folding monitored by H/D exchange, protein-ligand complex
formation under physiological conditions and macromolecular structure
determination
COMPONENETS:
Mass spectrometers can be divided into three fundamental parts, namely the ionisation source , the analyser , and the detector.
The sample has to be introduced into the ionisation source of the instrument. Once inside the ionisation source, the sample molecules are ionised, because ions are easier to manipulate than neutral molecules. These ions are extracted into the analyser region of the mass spectrometer where they are separated according to their mass (m) -to-charge (z) ratios (m/z). The separated ions are detected and this signal sent to a data system where the m/z ratios are stored together with their relative abundance for presentation in the format of a m/z spectrum.
The analyser and detector of the mass spectrometer, and often the ionisation source too, are maintained under high vacuum to give the ions a reasonable chance of travelling from one end of the instrument to the other without any hindrance from air molecules. The entire operation of the mass spectrometer, and often the sample introduction process also, is under complete data system control on modern mass spectrometers.
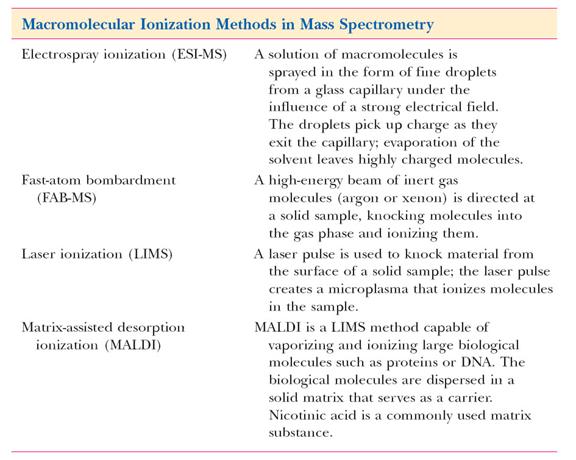
IONISATION SOURCE:
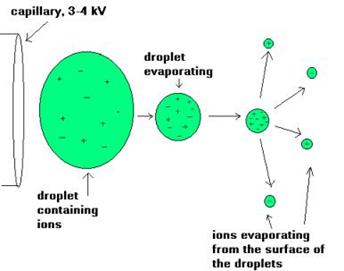
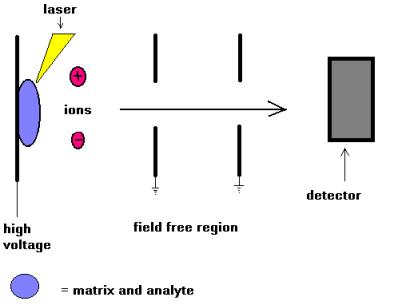
The ion source is the part of the mass spectrometer that ionizes the material under analysis (the analyte). The ions are then transported by magnetic or electric fields to the mass analyzer. The ionisation methods used for the majority of biochemical analyses are Electrospray Ionisation (ESI) and Matrix Assisted Laser Desorption Ionisation (MALDI).
MASS ANALYSER:
The main function of the mass analyser is to separate, or resolve, the ions formed in the ionisation source of the mass spectrometer according to their mass-to-charge (m/z) ratios. There are a number of mass analysers currently available, the better known of which include quadrupoles, time-of-flight (TOF) analysers, magnetic sectors, and both Fourier transform and quadrupole ion traps .
These mass analysers have different features, including the m/z range that can be covered, the mass accuracy, and the achievable resolution. The compatibility of different analysers with different ionisation methods varies. For example, all of the analysers listed above can be used in conjunction with electrospray ionisation, whereas MALDI is not usually coupled to a quadrupole analyser.
Tandem (MS-MS) mass spectrometers are instruments that have more than one analyser and so can be used for structural and sequencing studies. Two, three and four analysers have all been incorporated into commercially available tandem instruments, and the analysers do not necessarily have to be of the same type, in which case the instrument is a hybrid one. More popular tandem mass spectrometers include those of the quadrupole-quadrupole, magnetic sector-quadrupole , and more recently, the quadrupole-time-of-flight geometries.
Time of Flight (TOF):
It uses an electric field to accelerate the ions through the same potential, and then measures the time they take to reach the detector. If the particles all have the same charge, then their kinetic energies will be identical, and their velocities will depend only on their masses. Lighter ions will reach the detector first.
Quadrupole:
Quadrupole mass analyzers use oscillating electrical fields to selectively stabilize or destabilize ions passing through a radio frequency (RF) quadrupole field. A quadrupole mass analyzer acts as a mass selective filter and is closely related to the Quadrupole ion trap, particularly the linear quadrupole ion trap except that it operates without trapping the ions. A common variation of the quadrupole is the triple quadrupole.
DETECTORS:
The detector monitors the ion current, amplifies it and the signal is then transmitted to the data system where it is recorded in the form of mass spectra. The m/z values of the ions are plotted against their intensities to show the number of components in the sample, the molecular mass of each component, and the relative abundance of the various components in the sample.
The type of detector is supplied to suit the type of analyser; the more common ones are the photomultiplier, the electron multiplier and the micro-channel plate detectors.
MASS SPECTROMETRY SOFTWARE:
Mass spectrometry software is any software for data acquisition, analysis or data representation in mass spectrometry. A popular option that combines a comprehensive range of data analysis features is PEAKS. Other existing mass spec analysis software include: Peptide fragment fingerprinting (SEQUEST, Mascot, OMSSA and X!Tandem). Peptide de novo sequencing (LuteFisk, PepNovo, and Sherenga). Peptide sequence tag based searching (SPIDER, InsPecT, and GutenTAG).
PEAKS:
PEAKS is designed for peptide sequencing and protein identification from tandem mass spectrometry (MS/MS) data. Other than being used for search engine protein identification (Protein ID), it is one of the earliest adaptors for de novo sequencing (both automated and manual) and sequence tag based searching (SPIDER). In short, de novo sequencing is peptide sequencing performed without prior knowledge of the amino acid sequence. Some of the information PEAKS provides is a complete sequence for each peptide, confidence scores on individual amino acid assignments, simple reporting for high-throughput analysis. One of the most useful tools in any form of research is the ability to compare results. PEAKS inChorus will cross check test results automatically with other protein ID search engines, like Sequest, OMSSA, X!Tandem and Mascot. This approach guards against false positive peptide assignments, and provides the highest possible level of confidence.
SPIDER:
Common database search engines are unable to recognize some peptides. SPIDER, a sequence tag based search tool, complements protein identification by quickly seeking homology in proposed protein sequences. Partial sequence recognition allows for a greater understanding of post translatinoal modifications and sequence mutations.
SEQUEST:
SEQUEST is a popular tandem mass spectrometry data analysis program. Sequest identifies collections of tandem mass spectra to peptide sequences that have been generated from databases of protein sequences. This tool is most useful in the context of shotgun proteomics. Starting with a complex mixture of proteins, this strategy typically employs trypsin to digest proteins. These peptides are separated by liquid chromatography en route to a tandem mass spectrometer. The mass spectrometer then isolates ions of a particular peptide, subjects them to collision-induced dissociation, and records the produced fragments in a tandem mass spectrum. This process, repeated for several hours, will produce thousands of tandem mass spectra. Identifying such a data collection requires automation, and Sequest was the first software to fill that need. Sequest identifies each tandem mass spectrum individually. The software evaluates protein sequences from a database to compute the list of peptides that could result from each. The peptide's intact mass is known from the mass spectrum, and Sequest uses this information to determine the set of candidate peptides sequences that could meaningfully be compared to the spectrum by including only those which are near the mass of the observed peptide ion. For each candidate peptide, Sequest projects a theoretical tandem mass spectrum, and Sequest compares these theoretical spectra to the observed tandem mass spectrum by the use of cross correlation. The candidate sequence with the best matching theoretical tandem mass spectrum is reported as the best identification for this spectrum.
TANDEM MASS SPECTROMETRY
Tandem mass spectrometry (MS-MS) is used to produce structural information about a compound by fragmenting specific sample ions inside the mass spectrometer and identifying the resulting fragment ions. This information can then be pieced together to generate structural information regarding the intact molecule. Tandem mass spectrometry also enables specific compounds to be detected in complex mixtures on account of their specific and characteristic fragmentation patterns. A tandem mass spectrometer is a mass spectrometer that has more than one analyzer, in practice usually two. The two analyzers are separated by a collision cell into which an inert gas (e.g. argon, xenon) is admitted to collide with the selected sample ions and bring about their fragmentation. The analyzers can be of the same or of different types, the most common combinations being:
quadrupole - quadrupole
magnetic sector - quadrupole
magnetic sector - magnetic sector
quadrupole - time-of-flight.
Fragmentation experiments can also be performed on certain single analyzer mass spectrometers such as ion trap and time-of-flight instruments, the latter type using a post-source decay experiment to effect the fragmentation of sample ions.
Tandem MS (or MS/MS) allows sequencing of proteins by hooking two mass spectrometers in tandem. The first mass spectrometer is used to separate oligopeptides from a protein digest and then to select in turn each of these oligopeptides for further analysis. A selected ionized oligopeptide is directed toward the second mass spectrometer; on the way, this oligopeptide is fragmented by collision with helium or argon gas molecules, and the collection of fragments is analyzed by the second mass spectrometer. Fragmentation occurs primarily in the peptide bonds linking successive amino acids in the oligopeptide, so the fragments created represent a nested set of peptides that differ in size by one amino acid residue. The fragments differ in mass by 56 atomic mass units (the mass of the peptide backbone atoms (NH-CH-CO)) plus the mass of the R group at each position, which ranges from 1 atomic mass unit (Gly) to 130 (Trp). MS sequencing has the advantages of very high sensitivity, fast sample processing, and the ability to work with mixtures of proteins. Subpicomoles (less than 10_12 moles) of peptide can be analyzed. However, in practice, tandem MS is limited to rather short sequences (no longer than 15 or so amino acid residues).
PEPTIDPEPTIDE SEQUENCING BY TANDEM MASS SPECTROMETRY:
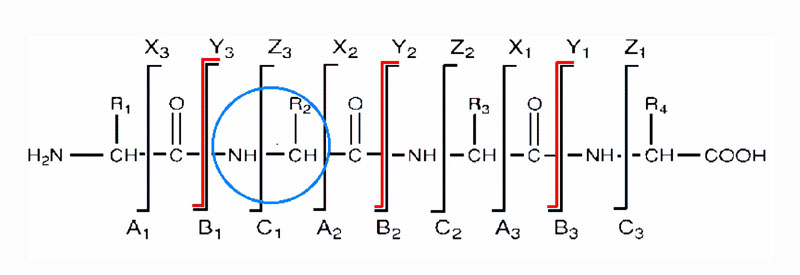
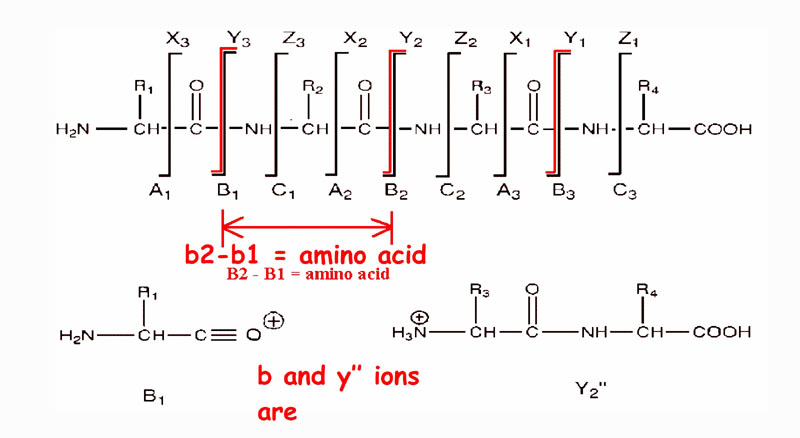
There are three different types of bonds that can fragment along the amino acid backbone: the NH-CH, CH-CO, and CO-NH bonds. Each bond breakage gives rise to two species, one neutral and the other one charged, and only the charged species is monitored by the mass spectrometer. The charge can stay on either of the two fragments depending on the chemistry and relative proton affinity of the two species. Hence there are six possible fragment ions for each amino acid residue and these are labelled as in the diagram, with the a, b, and c" ions having the charge retained on the N-terminal fragment, and the x, y", and z ions having the charge retained on the C-terminal fragment. The most common cleavage sites are at the CO-NH bonds which give rise to the b and/or the y" ions. The mass difference between two adjacent b ions, or y"; ions, is indicative of a particular amino acid residue.
Table of amino acid residues:
|
Symbol |
Structure |
Mass (Da) |
|
Ala A |
-NH.CH.(CH3).CO- |
71.0 |
|
Arg R |
-NH.CH.[(CH2)3.NH.C(NH).NH2].CO- |
156.1 |
|
Asn N |
-NH.CH.(CH2CONH2).CO- |
114.0 |
|
Asp D |
-NH.CH.(CH2COOH).CO- |
115.0 |
|
Cys C |
-NH.CH.(CH2SH).CO- |
103.0 |
|
Gln Q |
-NH.CH.(CH2CH2CONH2).CO- |
128.1 |
|
Glu E |
-NH.CH.(CH2CH2COOH).CO- |
129.0 |
|
Gly G |
-NH.CH2.CO- |
57.0 |
|
His H |
-NH.CH.(CH2C3H3N2).CO- |
137.1 |
|
Ile I |
-NH.CH.[CH.(CH3)CH2.CH3].CO- |
113.1 |
|
Leu |
-NH.CH.[CH2CH(CH3)2].CO- |
113.1 |
|
Lys K |
-NH.CH.[(CH2)4NH2].CO- |
128.1 |
|
Met M |
-NH.CH.[(CH2)2.SCH3].CO- |
131.0 |
|
Phe F |
-NH.CH.(CH2Ph).CO- |
147.1 |
|
Pro P |
-NH.(CH2)3.CH.CO- |
97.1 |
|
Ser S |
-NH.CH.(CH2OH).CO- |
87.0 |
|
Thr T |
-NH.CH.[CH(OH)CH3).CO- |
101.0 |
|
Trp W |
-NH.CH.[CH2.C8H6N].CO- |
186.1 |
|
Tyr Y |
-NH.CH.[(CH2).C6H4.OH].CO- |
163.1 |
|
Val V |
-NH.CH.[CH(CH3)2].CO- |
99.1 |
Peptide sequencing by tandem mass spectrometry - backbone cleavages
The extent of side-chain fragmentation detected depends on the type of analyzers used in the mass spectrometer. A magnetic sector - magnetic sector instrument will give rise to high energy collisions resulting in many different types of side-chain cleavages. Quadrupole - quadrupole and quadrupole - time-of-flight mass spectrometers generate low energy fragmentations with fewer types of side-chain fragmentations.
Immonium ions (labelled "i") appear in the very low m/z range of the MS-MS spectrum. Each amino acid residue leads to a diagnostic immonium ion, with the exception of the two pairs leucine (L) and iso-leucine (I), and lysine (K) and glutamine (Q), which produce immonium ions with the same m/z ratio, i.e. m/z 86 for I and L, m/z 101 for K and Q. The immonium ions are useful for detecting and confirming many of the amino acid residues in a peptide, although no information regarding the position of these amino acid residues in the peptide sequence can be ascertained from the immonium ions.
An example of an MS/MS daughter or product ion spectrum is illustrated below.
The molecular mass of the peptide was measured using standard mass spectrometric techniques and found to be 680.4Da, the dominant ions in the MS spectrum being the protonated molecular ions (M+H+) at m/z 681.4. These ions were selected for transmission through the first analyzer, then fragmented in the collision cell and their fragments analyzed by the second analyzer to produce the following MS/MS spectrum. The sequence (amino acid backbone) ions have been identified, and in this example the peptide fragmented predominantly at the CO-NH bonds and gave both b and y" ions. (Often either the b series or the y" series predominates, sometimes to the exclusion of the other). The b series ions have been labelled with blue vertical lines and the y" series ions have been labelled with red vertical lines. The mass difference between adjacent members of a series can be calculated e.g. b3-b2 = 391.21 - 262.16 = 129.05 Da which is equivalent to a glutamine (E) amino acid residue; and similarly y4 - y3 = 567.37 - 420.27 = 147.10 Da which is equivalent to a phenylalanine (F) residue. In this way, using either the b series or the y" series, the amino acid sequence of the peptide can be determined and was found to be NFESGK (note:. the y" series reads from right to left!). The immonium ions at m/z 102 merely confirm the presence of the glutamine (E) residue in the peptide.
PEPTIDE MAPPING:
Peptide mapping refers to the comparison of mobilities of peptide fragments from homologous proteins. Protein sequencing is time consuming process once, the primary structure of a protein has been elucidated, and however, that of nearly identical protein, e.g. protein from a closely related species, mutated protein etc., can be more easily determined by peptide mapping or finger printing. Peptide mapping done by combining paper chromatography and paper electrophoresis digest. It can also be obtained by single mass spectrometer. Peptide mass fingerprinting uses the masses of proteolytic peptides as input to a search of a database of predicted masses that would arise from digestion of a list of known proteins. If a protein sequence in the reference list gives rise to a significant number of predicted masses that match the experimental values, there is some evidence that this protein was present in the original sample. Peptide fragments incorporating the amino acid variations migrate to different positions on their peptide map (finger prints). When compared to the corresponding peptides of the known protein, the sequence of peptide fragments creating similar spots identified but varying/differing spots are determined by eluting and sequencing by the normal methods.
REVERSE SEQUENCING:
In this technique, amino acid sequence of protein determined by analyzing the nucleotide sequence of corresponding DNA that codes for protein. This is because DNA directs the amino acid sequence in protein. This technique, however, fails to identify the disulfide bonds and changes that occur in the amino acids after the protein is synthesized i.e. post translational modifications. Bioinformatic tools like ExPASy Translate tool might be used for this purpose.