PROTEIN ISOLATION AND PURIFICATION
Protein isolation and purification achieved in several steps namely,
1. CELL DISRUPTION:
In order to isolate and purify protein, first the location of the protein should be identified. A protein might be present in the cell membrane or in cytosol or in any one of the intracellular organelle. If protein present in the extracellular phase of the membrane i.e. outer leaflet of membrane, then protein might be released from the cell simply using detergents. There is no need for cell disruption in this case. If protein present in other locations then cell disruption has to be carried out.
Cell disruption can be achieved in any one of the following methods.
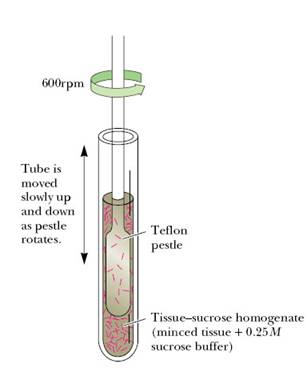
Detergents generally used to disrupt the cell membrane and release the contents from the cell. Lysozyme mostly used to lyse the cell wall with peptidoglycan layer. So, it was mostly used for lysing gram negative and gram positive bacterial cells. For gram negative bacterial lysis lysozyme require detergents also for its lytic phenomenon due to the presence of outer membrane in gram negative bacteria. Ultrasonic vibrations also used for cell disruption. Osmotic phenomenon used for cell lysis. For example, to lyse RBCs and release hemoglobin, RBCs are placed in water. Due to osmotic pressure water moves into RBCs to neutralize the salt concentration. Because of this endo osmotic action, RBCs lysed and hemoglobin released. Eventhough different methods available for cell disruption, the most common and simple method used was homogenization. This was carried out using Homogenizer and Pestle. For this, cell fraction or mixture mixed with suitable buffer and placed in homogenizer and Teflon pestle rotated at a speed of 600rpm which results in the formation of homogenized mixture by cell disruption.
2. FRACTIONATION:
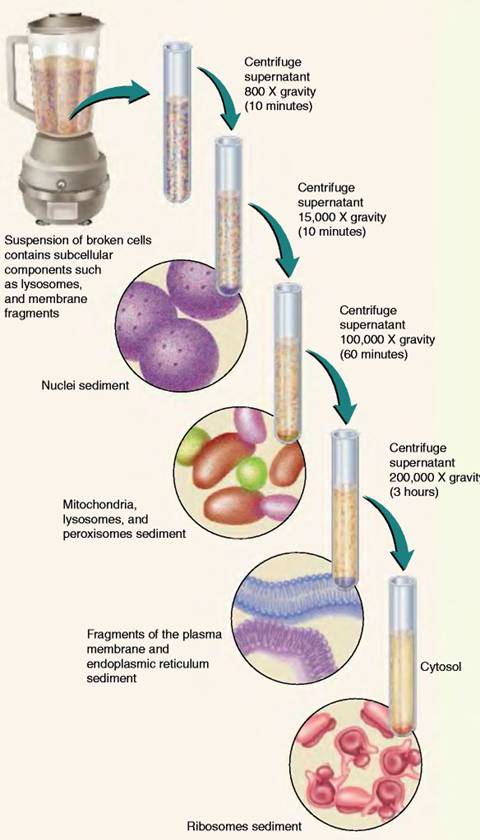
After homogenized mixture formed, from the mixture particular fraction which contains our protein of interest must be obtained for further analysis. If the protein was present in the intracellular organelle, specific intracellular organelle should be fractionated and it was further disrupted and the extract used for further purification processes. Fractionation was achieved by ultracentrifuge and differential centrifugation.
Initially, the homogenate is spun in the centrifuge at low speed (700 -1,000 g) for 10 to 20 minutes. The heavier particles, such as the nuclei, form sediment, or pellet. Lighter particles, such as mitochondria and lysosomes, remain suspended in the supernatant, the liquid above the pellet. The supernatant is then transferred to another centrifuge tube and spun at a higher speed (15,000 to 20,000 g) for 10-20 minutes. The resulting pellet contains mitochondria, lysosomes, and peroxisomes. The supernatant, which contains microsomes (small closed vesicles formed from ER during homogenization), is transferred to another tube and spun at 100,000 g for 60-120 minutes. Microsomes are deposited in the pellet, and the supernatant contains ribosomes, various cellular membranes, and granules such as glycogen, a carbohydrate polymer. After this latest supernatant is recentrifuged at 200,000 g for 2 to 3 hours, ribosomes and large macromolecules are recovered from the pellet.
The ultracentrifuge is also used to separate cellular components on the basis of their buoyant density, independently of their size and shape. In this case the sample is usually sedimented through a steep density gradient that contains a very high concentration of sucrose or cesium chloride. Each cellular component begins to move down the gradient, but it eventually reaches a position where the density of the solution is equal to its own density. At this point the component floats and can move no farther. A series of distinct bands is thereby produced in the centrifuge tube, with the bands closest to the bottom of the tube containing the components of highest buoyant density.
3. CRUDE SAMPLE PREPARATION:
After the protein-containing fraction has been obtained, several relatively crude methods may be used to enhance purification. Processes like Salting out, Dialysis and Gel extrusion chromatography were used for this purpose.
a. Salting out:
It is a technique in which high concentrations of salts such as ammonium sulfate [(NH4JSO4] are used to precipitate proteins. Because each protein has a characteristic salting-out point, this technique removes many impurities. Unwanted proteins that remain in solution are then discarded when the liquid is decanted. When proteins are tightly bound to membrane, organic solvents or detergents often aid in their extraction. For example, 0.8 M ammonium sulfate precipitates fibrinogen, a blood-clotting protein, whereas a concentration of 2.4 M is needed to precipitate serum albumin. Salting out is also useful for concentrating dilute solutions of proteins, including active fractions obtained from other purification steps. Dialysis can be used to remove the salt if necessary.
b. Dialysis:
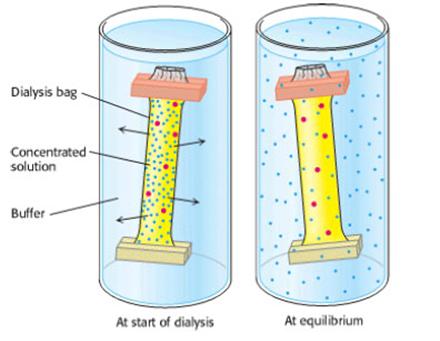
Proteins can be separated from small molecules by dialysis through a semipermeable membrane, such as a cellulose membrane with pores. Molecules having dimensions significantly greater than the pore diameter are retained inside the dialysis bag, whereas smaller molecules and ions traverse the pores of such a membrane and emerge in the dialysate outside the bag. This technique is useful for removing a salt or other small molecule, but it will not distinguish between proteins effectively. The speed of dialysis might be increased by using hot water and electrical field. Ultrafiltration is an improvement on the dialysis principle. Filters having pore sizes over the range of biomolecular dimensions are used to filter solutions to select for molecules in a particular size range. Because the pore sizes in these filters are microscopic, high pressures are often required to force the solution through the filter. This technique is useful for concentrating dilute solutions of macromolecules. The concentrated protein can then be diluted into the solution of choice.
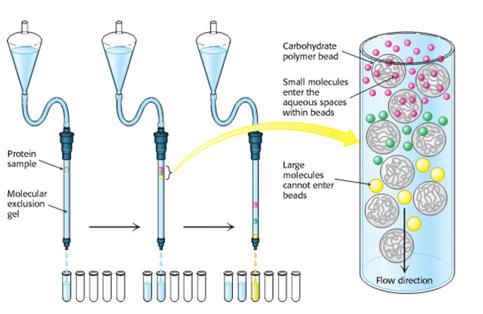
c. Gel Filtration Chromatography:
More discriminating separations on the basis of size can be achieved by the technique of gel-filtration chromatography. The sample is applied to the top of a column consisting of porous beads made of an insoluble but highly hydrated polymer such as dextran or agarose (which are carbohydrates) or polyacrylamide. Sephadex, Sepharose, and Bio-gel are commonly used commercial preparations of these beads, which are typically 100 mm (0.1 mm) in diameter. Small molecules can enter these beads, but large ones cannot. The result is that small molecules are distributed in the aqueous solution both inside the beads and between them, whereas large molecules are located only in the solution between the beads. Large molecules flow more rapidly through this column and emerge first because a smaller volume is accessible to them. Molecules that are of a size to occasionally enter a bead will flow from the column at an intermediate position, and small molecules, which take a longer, tortuous path, will exit last.
4. PURIFICATION:
As a protein sample becomes progressively more pure, more sophisticated methods are used to achieve further purification. The most commonly used techniques include chromatography and electrophoresis. Of these methods mainly two dimensional gel electrophoresis and affinity chromatography mostly used.
To determine the success of a protein purification scheme, monitor the procedure at each step by determining specific activity and by performing an SDS-PAGE analysis. Consider the results for the purification of a fictitious protein. At each step, the following parameters are measured:
Total protein: The quantity of protein present in a fraction is obtained by determining the protein concentration of a part of each fraction and multiplying by the fraction's total volume.
Total activity: The enzyme activity for the fraction is obtained by measuring the enzyme activity in the volume of fraction used in the assay and multiplying by the fraction's total volume.
Specific activity: This parameter is obtained by dividing total activity by total protein.
Yield: This parameter is a measure of the activity retained after each purification step as a percentage of the activity in the crude extract. The amount of activity in the initial extract is taken to be 100%.
Purification level: This parameter is a measure of the increase in purity and is obtained by dividing the specific activity, calculated after each purification step, by the specific activity of the initial extract.
For example, if homogenization, salt fractionation, Ion Exchange chromatography, Gel filtration and Affinity chromatography carried out for purification of protein. The above mentioned parameters analyzed in the sample each time and reported as in the following table:
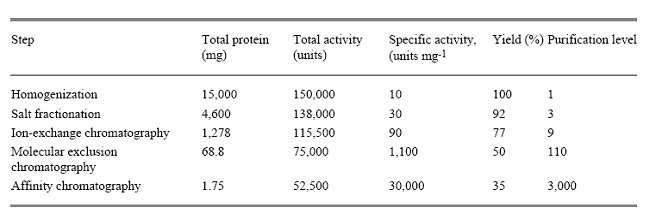
The first purification step, salt fractionation, leads to an increase in purity of only 3-fold, but recover nearly all the target protein in the original extract, given that the yield is 92%. After dialysis to lower the high concentration of salt remaining from the salt fractionation, the fraction is passed through an ion-exchange column. The purification now increases to 9-fold compared with the original extract, whereas the yield falls to 77%. Molecular exclusion chromatography brings the level of purification to 100-fold, but the yield is now at 50%. The final step is affinity chromatography with the use of a ligand specific for the target enzyme. This step, the most powerful of these purification procedures, results in a purification level of 3000-fold, while lowering the yield to 35%. The SDS-PAGE shows that, if load a constant amount of protein onto each lane after each step, the number of bands decreases in proportion to the level of purification, and the amount of protein of interest increases as a proportion of the total protein present.
A good purification scheme takes into account both purification levels and yield. A high degree of purification and a poor yield leave little protein with which to experiment. A high yield with low purification leaves many contaminants (proteins other than the one of interest) in the fraction and complicates the interpretation of experiments.

1. TWO DIMENSIONAL GEL ELECTROPHORESIS (2DGE):
SAMPLE PREPARATION:
Sample preparation is a key factor in successful 2DE, with complete solubilisation and denaturation of sample proteins being the ultimate aim.
Use fresh tissue or sample and do not leave it on the bench. Remember, the final result can only be as good as the starting material. Make sure the sample looks alright, there’s nothing better than your eyes for picking out potential problems.
Don't handle the sample, always use rubber gloves, clean glassware and equipment. It was found that it is fairly easy to inadvertently contaminate samples with skin, hair etc from the operator and this is especially important when silver staining is used for protein visualization. These contaminants, once identified, can act as landmarks, but generally are unsightly and undesirable. Once again, contaminants will produce unreliable results and will complicate analysis of the completed gel. The sample might be contaminated with host tissue. For example, tissue dwelling organisms such as Fasciola hepatica will be coated in host material and may also harbor more in their gut. Whatever your sample is, always be aware of possible contaminants.
What potential components are there those may complicate protein solubilisation or subsequent running of the gel should be identified and care should be taken otherwise the 2D gel result in failure.
Protease activity can vary greatly between organisms and their activities should never be ignored. Their presence in your sample should have a bearing on how it is handled, keep it cold, freezing it is the best policy, either at -70oC or in liquid nitrogen. The analyst need not thaw it until place it in the sample buffer, where if necessary protease inhibitors can be added.
Is there a limited supply of sample? This will certainly influence the preparation technique used. If you can only muster a few hundred micrograms of your precious material its imperative that you don't waste any. Try to get into the habit of using sample volumes that reflect how much you will require for your work. As an example, if you have 50mg of sample and for arguments sake, say it has a 10% protein content that means you have 5mg of total protein. If you add that sample to 1ml of buffer, that will give you 5mg/ml of protein. Now, say you want to add 2mg of that protein to a 17cm Bio-Rad IPG strip. To rehydrate that strip you will need 300µl of buffer that means that even if you "in gel" rehydrate your sample you will only be able to add 1.5mg of protein. Once you have solubilised it in the sample buffer there is no way of concentrating it further and your precious sample with have been wasted.
In some samples a single protein or a small number may be present in such abundance that they mask many other proteins of interest. If this is the case then there may be no other course than to remove them from the sample. A number of methods are available. For instance, use of increasingly active detergents or increasingly denaturing buffers. If you're only interested in certain proteins in you sample, for instance glutathione transferases, then you can always run it through an affinity column first before running them on a gel. Pre-fractionation isn't generally recommended if you wish to use the subsequent sample for differential expression experiments as any differences observed between samples might be due to these manipulations.
INTERFERING SUBSTANCES:
Not generally a problem, except in the case of membrane bound proteins. Lipids can bind to proteins changing both their pI and MW. For this reason it is important to add adequate detergent. Delipidation by solvent extraction can be undertaken but may lead to excessive protein loss and may also increase sample variability. In some preparations lipids tend to form a zone at the top of the sample after ultracentrifugation that can be easily removed and discarded.
Proteases can be a severe problem. The denaturing properties of the SD buffer are often sufficient to inhibit the action of many proteases. There are many types of proteases, so use of the correct protease inhibitors is important. It may be worth checking the literature for information on protease activity in your organism. Peptide inhibitor cocktails are available that have a wide activity range. These inhibitors are peptides and as such will focus at their pI's, so do not add too much. SDS solubilisation followed by TCA/acetone treatment might improve samples but is not ideal as some proteases have increased activity to proteins denatured with SDS. Careful handling may be crucial, keep the sample cold at all times. But remember, SD buffers with high concentrations of urea should not be chilled too much as precipitation is likely.
It can block gel pores and increase sample viscosity, they may also bind proteins, particularly nucleic acid binding proteins that will then be depleted and so will not be fully represented on the gel. By ultracentrifugation; the higher density of nucleic acids ensures that they are removed without the loss of proteins.
Uncharged (starch, glycogen) polysaccharides can block gel pores, inhibiting migration of sample proteins resulting in poor focusing. These can simply be removed by ultracentrifugation and should not pose any real problems. Charged (mucins, dextrans) polysaccharides, on the other hand, bind protein due to charge and so can deplete some proteins. They can also be very difficult to remove. Polysaccharides cause severe smearing that is evident with both silver and Coomassie staining.
High concentrations of salt can pose problems to the integrity of the IEF gel. It can lead to zones of dehydration in the gel which result in loss of current within the strip. This problem can be especially bad with excretory/secretory products, if the sample has been lyophilised. In this case it is best to dialyse the sample before lyophilisation to remove as much of the salt as possible.
PROCEDURE OF 2D GEL ELECTROPHORESIS:
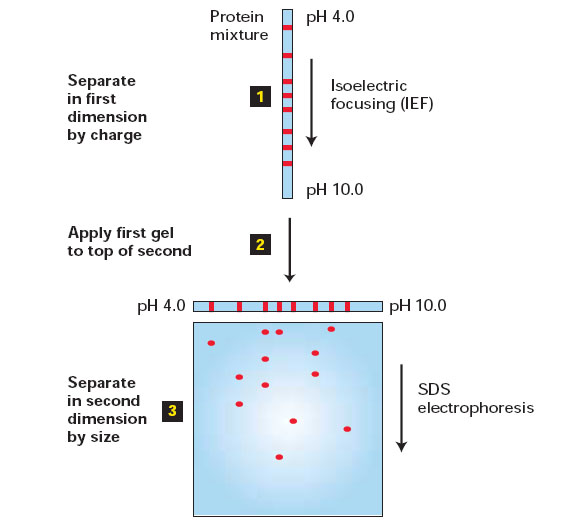
Since closely spaced protein bands or peaks tend to overlap, one-dimensional separation methods, such as SDS polyacrylamidegel electrophoresis or chromatography, can resolve only a relatively small number of proteins (generally fewer than 50). In contrast, two-dimensional gel electrophoresis, which combines two different separation procedures, can be used to resolve more than 1000 proteins in the form of a two-dimensional protein map. In this technique, two methods were used namely Iso Electro Focusing (IEF) and SDS-PAGE, so this method was also called as Iso-Dalt technique depending upon the principle used for these two techniques i.e. isoelectric point and mass (Daltons) of proteins respectively.
In the first step the proteins are separated on the basis of their intrinsic charge. The sample is dissolved in a small volume of a solution containing a nonionic (uncharged) detergent, together with mercaptoethanol and the denaturing reagent urea. This solution solubilizes, denatures, and dissociates all the polypeptide chains but leaves their intrinsic charge unchanged. The polypeptide chains are then separated by a procedure called isoelectric focusing, which depends on the fact that the net charge on a protein molecule varies with the pH of the surrounding solution. For any protein there is a characteristic pH, called its isoelectric point, at which the protein has no net charge and therefore will not migrate in an electric field. In isoelectric focusing, proteins are electrophoresed in a narrow tube of polyacrylamide gel in which a gradient of pH is established by a mixture of special buffers. Each protein moves to a position in the gradient that corresponds to its isoelectric point and stays there. This is the first dimension of two-dimensional gel electrophoresis.
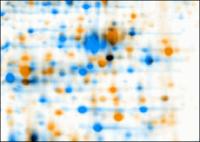
In the second step the narrow gel containing the separated proteins is again subjected to electrophoresis but in a direction at right angles to that used in the first step. This time SDS is added, and the proteins are separated according to their size, as in one-dimensional SDS-PAGE: the original narrow gel is soaked in SDS and then placed on one edge of an SDS polyacrylamide-gel slab, through which each polypeptide chain migrates to form a discrete spot. This is the second dimension of two-dimensional polyacrylamide-gel electrophoresis. The only proteins left unresolved will be those that have both an identical size and an identical isoelectric point, a relatively rare situation. Even trace amounts of each polypeptide chain can be detected on the gel by various staining procedures - or by autoradiography if the protein sample was initially labeled with a radioisotope. Up to 2000 individual polypeptide chains - almost the number of different proteins in a bacterium - have been resolved on a single two-dimensional gel. The resolving power is so great that two proteins that differ in only a single charged amino acid can be readily distinguished.
A specific protein can be identified after its fractionation on either one-dimensional or two-dimensional gels by exposing all the proteins present to a specific antibody that has been coupled to a radioactive isotope, to an easily detectable enzyme, or to a fluorescent dye. For convenience, this is normally done after all the separated proteins present in the gel have been transferred (by "blotting") onto a sheet of nitrocellulose paper.
This is a negatively staining technique. The background of the gel is stained whilst the proteins leave clear spots that can be visualized against an appropriate background. This is because zinc and copper does not stain SDS, with which the proteins have been coated, but do stain the gel matrix. This technique is quick, easy and cheap and as the proteins are not stained there is no problem with downstream processing. It detects 6-12ng.
There are a large number of protocols for Coomassie staining and a number of different Coomassie stains. Generally, like the above staining technique, they are quick, easy and cheap although making up the stain initially can be a little messy. It is important to make up fresh stain regularly as it loses its sensitivity as it gets older. You can also opt for the more expensive ready made stains such as Bio-safe Coomassie (Bio-Rad), most companies (Pierce, Sigma) make these and suggest that they are more sensitive than conventional Coomassie stain; they also require much less destaining and are kinder to the environment. This stain is not specific and will also detect non protein components such as polysaccharides. Its sensitivity is fairly good and it is compatible with mass spectroscopy. It detects 36-47ng.
This is normally a time consuming and expensive staining technique that requires good quality substrates, but can give excellent results. Just lately a lot of new protocols have been described that are compatible with mass spectroscopy. The great advantage of this type of staining is its sensitivity, however like Coomassie stain it suffers from lack of specificity. It also suffers from a lack of dynamic range, making quantification of protein in spots highly unreliable, this can be noted in some negatively stained proteins that might appear on gel. It can detect 0.5-1.2ng protein.
There are many different types of fluorescent stain and most are easy and relatively quick to use. Some are fairly cheap and can be used more than once; others like SYPRO ruby are shockingly expensive. These dyes are said to be both selective and quantitative. That means that unlike silver the intensity of the protein spot can be directly correlated to the quantity of protein present. SYPRO ruby is also said to be as sensitive as silver staining. Obviously you will need some sort of gel documentation system as these stains can't be seen with a naked eye. There are disadvantages of this stain, as once more, with the use of SYPRO ruby the sensitivity issue puts the onus onto the mass spec. It can detect 1-2ng. Read the product literature carefully, many stains cannot be used with Pharmacia's plastic backed gel system as the plastic backing or the gelbond is fluorescent at the excitation wavelength of the stain and so produces unacceptable background levels.
APPLICATIONS OF 2D GEL ELECTROPHORESIS:
The sequential resolution of proteins by charge and mass can achieve excellent separation of cellular proteins. For example, two-dimensional gels have been very useful in comparing the proteomes in undifferentiated and differentiated cells or in normal and cancer cells because as many as 1000 proteins can be resolved simultaneously.
2D gel electrophoresis is generally used as a component of proteomics and is the step used for the isolation of proteins for further characterization by mass spectroscopy. In the lab this technique was used for 2 main purposes, firstly for the large scale identification of all proteins in a sample. This is undertaken when the global protein expression of an organism or a tissue is being investigated and is best carried out on model organisms whose genomes have been fully sequenced. In this way the individual proteins can be more readily identified from the mass spectrometry data. The second use of this technique is differential expression. For instance, one may be looking at drugs resistance in a parasite. In this case analyst might like to compare a resistant organism to a susceptible one in an attempt to find the changes responsible for the resistance. Here the sequence requirements of the organism are not as important, as analyst is looking for a relatively small number of differences and so can devote more time to the identification of each protein.
2D GEL ANALYSIS SOFTWARE:
In proteomics research, these tools primarily analyze biological markers by quantifying individual markers, and showing the separation between one or more protein "spots" on a scanned image of a 2-DE product. These tools may also be used to match spots between gels of similar samples to show, for example, proteomic differences between early and advanced stages of an illness. However, though some tools tend to agree on the quantification and analysis of well-defined, well-separated protein spots, they deliver different results and tendencies with less-defined, less-separated spots.
Modern day 2-DE research often utilizes software-based image analysis tools. These tools primarily analyze bio-markers by quantifying individual proteins, and showing the separation between one or more protein "spots" on a scanned image of a 2-DE product. Additionally, these tools match spots between gels of similar samples to show, for example, proteomic differences between early and advanced stages of an illness. Software packages include Delta2D, PDQuest and Progenesis. While this technology is widely utilized, the intelligence has not been perfected. For example, while PDQuest and Progenesis tend to agree on the quantification and analysis of well-defined well-separated protein spots, they deliver different results and analysis tendencies with less-defined less-separated spots. Challenges for automatic software-based analysis include:
a. incompletely separated (overlapping) spots (less-defined and/or separated)
b. weak spots / noise (e.g., "ghost spots")
c. running differences between gels (e.g., protein migrates to different positions on different gels)
d. differences in software algorithms and therefore analysis tendencies
Modern software packages include advanced features, such as image warping, to try to compensate for running differences between gels. However, 2-DE automated image analysis technology not been perfected - a fact which keeps manual visual analysis as the "gold standard" for validation. More advanced methods of discovery include the use of mass spectrometry.
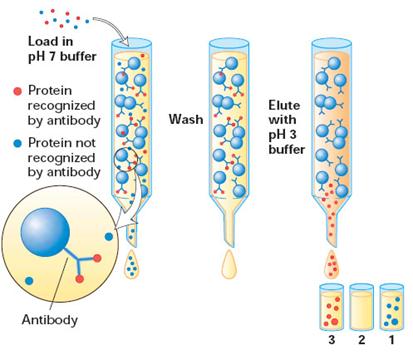
2. AFFINITY CHROMATOGRAPHY:
Recently, affinity purification strategies for proteins have been developed to exploit the biological function of the target protein. In most instances, proteins carry out their biological activity through binding or complex formation with specific small biomolecules, or ligands, as in the case of an enzyme binding its substrate. If this small molecule can be immobilized through covalent attachment to an insoluble matrix, such as a chromatographic medium like cellulose or polyacrylamide, then the protein of interest, in displaying affinity for its ligand, becomes bound and immobilized itself. It can then be removed from contaminating proteins in the mixture by simple means such as filtration and washing the matrix. Finally, the protein is dissociated or eluted from the matrix by the addition of high concentrations of the free ligand in solution. Because this method of purification relies on the biological specificity of the protein of interest, it is a very efficient procedure and proteins can be purified several thousand fold in a single step.
Now the isolated and purified sample might be used for protein sequencing.