Introduction
Nutrition is the sum total of the processes involved in the taking in and the utilization of food substances by which growth, repair and maintenance of the body are accomplished. It involves ingestion, digestion, absorption and assimilation.
A nutrient is a chemical that an organism needs to live and grow or a substance used in an organism's metabolism which must be taken in from its environment. They are used to build and repair tissues, regulate body processes and are converted to and used as energy. Nutrients are stored by the body in various forms and drawn upon when the food intake is not sufficient. Organic nutrients include carbohydrates, fats, proteins (or their building blocks, amino acids), and vitamins. Inorganic chemical compounds such as dietary minerals, water, and oxygen may also be considered nutrients.
Nutrients needed in very small amounts are micronutrients and those that are needed in larger quantities are called macronutrients. The effects of nutrients are dose-dependent and shortages are called deficiencies. Macronutrients are defined in several different ways. The chemical elements humans consume in the largest quantities are carbon, hydrogen, nitrogen, oxygen, phosphorus, and sulphur, or CHNOPS. The classes of chemical compounds humans consume in the largest quantities and which provide bulk energy are carbohydrates, proteins, and fats. Water and atmospheric oxygen also must be consumed in large quantities, but are not always considered "food" or "nutrients". Calcium, salt (sodium and chloride), magnesium, and potassium (along with phosphorus and sulfur) are sometimes added to the list of macronutrients because they are required in large quantities compared to other vitamins and minerals. They are sometimes referred to as the macrominerals. Nutrients are frequently categorized as essential or nonessential. Essential nutrients are unable to be synthesized internally (either at all, or in sufficient quantities), and so must be consumed by an organism from its environment. Nonessential nutrients are those nutrients that can be made by the body, they may often also be absorbed from consumed food. The majority of animals ultimately derive their essential nutrients from plants, though some animals may consume mineral-based soils to supplement their diet.
For humans, these include essential fatty acids, essential amino acids, vitamins, and certain dietary minerals. Oxygen and water are also essential for human survival, but are generally not considered "food" when consumed in isolation. Humans can derive energy from a wide variety of fats, carbohydrates, proteins, and ethanol, and can synthesize other needed amino acids from the essential nutrients.
Non-essential substances within foods can still have a significant impact on health, whether beneficial or toxic. For example, most dietary fiber is not absorbed by the human digestive tract, but is important in digestion and absorption of otherwise harmful substances. Interest has recently increased in phytochemicals, which include many non-essential substances which may have health benefits.
Body weight
The term body weight is the Earth's gravitational pull on an organism's body. Body weight is measured in kilograms throughout the world. Body weight of a person is theoretically the weight of the person without any items on. However, for all practical purposes, body weight is taken with clothes on but often without the shoes and heavy accessories like mobile phones and wallets. In physics, body mass (an expression of matter that does not change due to gravity) is expressed in kilograms while body weight (which is an expression of force that includes gravity) is expressed in newtons. The stability of body weight depends on the energy intake and expenditure. When energy intake exceeds output, the excess energy is stored in the body as carbohydrates, proteins or fats and this causes a gain in body weight. The converse is also true. When energy expenditure exceeds energy intake, body weight decreases.
By region
|
Region |
Adult population |
Average weight |
Overweight population / |
|
Africa |
535 |
60.7 kg (133.8 lb) |
28.9% |
|
Asia |
2,815 |
57.7 kg (127.2 lb) |
24.2% |
|
Europe |
606 |
70.8 kg (156.1 lb) |
55.6% |
|
Latin America and the Caribbean |
386 |
67.9 kg (149.7 lb) |
57.9% |
|
Northern America |
263 |
80.7 kg (177.9 lb) |
73.9% |
|
Oceania |
24 |
74.1 kg (163.4 lb) |
63.3% |
|
World |
4,630 |
62.0 kg (136.7 lb) |
34.7% |
ESTIMATION OF BODYWEIGHT IN CHILDREN
A number of ways to estimate weight in children have been developed for circumstances (such as emergencies) when actual weight cannot be measured. The most commonly used methods include guesses of the child's weight by parents or healthcare providers, weight-estimation formulas based on the child's age and tape-based systems of weight estimation. Some of the many formulas that have been used include the APLS formula, the Leffler formula, and Theron formula. There are several tape-based systems for estimating children's weight, the most well-known of which is the Broselow tape. The Broselow tape is based on length with weight read from the appropriate color area. Newer systems, such as the PAWPER tape, make use of a simple two-step process to estimate weight: the length-based weight estimation is modified according to the child's body habitus to increase the accuracy of the final weight prediction.
The Leffler formula is used for children 0–10 years of age. In those less than a year old it is
![]()
and for those 1–10 years old it is
![]()
where m is the number of kilograms the child weighs and am and ay respectively are the number of months or years old the child is.
The Theron formula is
![]()
where m and ay are as above.
BODY COMPOSITION
Body composition refers to the make up of lean tissue and fat tissue in the body. Lean tissue is composed of muscle, bone and organs. Fat tissue is composed of three different categories: essential fat, storage fat and non-essential fat. Essential and storage fat are both necessary for the body to function, while non-essential fat serves no real purpose. Body composition otherwise refers to the proportion of fat and fat-free mass in the body.
Five levels of body composition
Human body composition can be studied at the atomic, molecular, cellular, tissue, and whole body level. These five levels are related to each other. For example, information at the atomic level can be used, subject to certain assumptions, to provide information at the whole body level.
Atomic level
Many chemical elements (atoms) are found in the human body, but the six elements oxygen, carbon, hydrogen, nitrogen, calcium, and phosphorus are the most abundant and together account for more than 98% of body weight (Table 2.1). Indeed, the 11 most common elements account for 99.5% of the atomic body composition. This information was initially based on chemical analysis of carcasses, but today the information can also be obtained by in vivo neutron activation analysis (IVNAA). The classical chemical cadaver analysis, as carried out mainly in the 1940s, still forms the basis for many in vivo techniques that are used to assess body composition.
Molecular level
The chemical elements in the human body are bound in molecules and, in very global terms, the main compartments are water, lipids, proteins, minerals, and carbohydrates. The total amount of water in the body is high and, depending on the body fat content, can be as high as 60–70% of total body weight. Total body water can be divided into intracellular water and extracellular water, and the ratio of the two is an important health parameter that is disturbed in many diseases (Box 2.1).
Lipids appear in the human body in different forms. Essential structural lipids such as the phospholipids (cell membranes) and sphingomyelin (nervous system) form only a minor part of the total lipids in the body. The nonessential lipids, mostly triglycerides or triacylglycerol (fat), are the most abundant. They are the energy store of the adult human body, insulate against cold, protect vital organs such as the kidneys against mechanical damage, and, to a certain extent, enhance the body’s appearance. In a “normal weight” healthy adult, the amount of body fat varies between 10% and 25% in men and between 15% and 35% in women. In severe obesity body fat can be as high as 60–70% of body weight. Body protein varies between 10% and 15%. It is higher in males than in females, as males generally have more muscles. There is no protein storage in the body and, generally speaking, loss of protein coincides with a loss of functionality given the high protein content and high protein turnover rates in vital organs. The amount of minerals in the body varies between 3% and 5%, again dependent on body fat. Calcium and phosphorus are the two main minerals. They are found mainly in bones. Carbohydrates are found in the body as glucose (blood sugar) and glycogen, a polysaccharide in muscle and liver cells that serves as a short-term energy store. The amount of carbohydrates in the body rarely exceeds 500 g. Table 2.2 gives the body composition of the reference man at a molecular level.
Cellular level
At the cellular level, body composition can be described in terms of body cell mass, extracellular fluids, and extracellular solids. The body cell mass includes the cells with all their contents, such as water, proteins, and minerals. Extracellular fluid contains about 95% water, which is plasma in the intravascular space and interstitial fluid in the extravascular space. Extracellular solids are mainly proteins (e.g., collagen) and minerals (bone minerals and soluble minerals in the extracellular fluid). Body composition at the cellular level is not easy to measure, owing to its complex nature. As will be discussed later, the 40K method can be used to assess body cell mass and some dilution techniques, for example bromide dilution, can be used to assess extracellular water.
Tissue level
Cells with equal functions form tissues, including muscular, connective, epithelial, and nervous tissue. Bones are connective tissue and consist mainly of hydroxyapatite, [Ca3(PO4)2]3Ca(OH)2, bedded in a protein matrix. A rather simple body composition model at the tissue level would be:
Body weight = adipose tissue + skeletal muscle + bone + organs + rest
Several of these components can now be measured with, for example, computed tomography (CT) or magnetic resonance imaging (MRI) for adipose tissue; creatinine excretion or N-methyl-histidine excretion in 24 h urine for skeletal muscle; dual-energy X-ray absorptiometry (DXA) for bones; and MRI or ultrasound for organs. Body composition at the tissue level is given in Table 2.3.
Whole body level
Body composition measurements at the whole body level use simple body parameters to give an insight into body composition. Formulae, based on statistical relationships that have been established in earlier studies between body parameters (e.g., skin fold thickness) and information on body composition (e.g., body fat by density), also enable the assessment of body composition. Another example is the assessment of body water based on weight, height, age, and gender.
Measurement of Body composition
Body composition particularly body fat percentage can be measured in several ways. The most common method is by using gun calipers to measure the thickness of subcutaneous fat in multiple places on the body. This includes the abdominal area, the subscapular region, arms, buttocks and thighs. These measurements are then used to estimate total body fat with a margin of error of approximately four percentage k points.
Another method is bioelectrical impedance analysis (BIA), which uses the resistance of electrical flow through the body to estimate body fat.
Assessment of somatic (skeletal) protein is typically determined by simple measurements and calculations including mid arm circumference (MAC), mid arm muscle circumference (MAMC), and creatinine height ratio (CHI). Creatinine height ratio is calculated as: 24 hour urine creatinine x 100/ expected 24 hour urine creatinine for height. This calculation results in a percentage which can indicate protein depletion.
A technique for measuring body composition has been developed using the same principles as under water weighing. The technique uses air, as opposed to water and is known as air displacement plethysmography (ADP). Subjects enter a sealed chamber that measures their body volume through the displacement of air in the chamber. Body volume is combined with body weight (mass) in order to determine body density. The technique then estimates the percentage of body fat and lean body mass (LBM) through known equations (for the density of fat and fat free mass).

Body composition measurement with Air Displacement Plethysmography (ADP) technology.
Body composition measurement with Dual energy X-ray absorptiometry (DEXA) is used increasingly for a variety of clinical and research applications. Total body or estimated total body scans using DEXA give accurate and precise measurements of BMD and body composition, including bone mineral content (BMC), bone mineral density (BMD), lean tissue mass, fat tissue mass, and fractional contribution of fat.
These measurements are extremely reproducible, making them excellent for monitoring pharmaceutical therapy, nutritional or exercise intervention, sports training &/or other body composition altering programs. They are also fast, simple, non-invasive, and expose the subject to a level of x-rays less than that of a cross-country flight. DEXA exams provide both total body and up to 14 regional (trunk, individual arms & legs, android, gynoid, etc.) results.
Body Composition is also estimated using cross-sectional imaging methods like magnetic resonance imaging (MRI) and computed tomography (CT). Since MRI and CT give the most precise body composition measures to-date, many pharmaceutical companies are very interested in this new procedure to estimate body composition measures before and after drug therapy especially in drugs that might change body composition.
Ultrasound has also been used to measure subcutaneous fat thickness, and by using multiple points a measurement of body composition can be made. Ultrasound has the advantage of being able to also directly measure muscle thickness and quantify intramuscular fat.
BODY MASS INDEX (BMI)
The body mass index (BMI), or Quetelet index, is a heuristic proxy for human body fat based on an individual's weight and height. BMI does not actually measure the percentage of body fat. It was devised between 1830 and 1850 by the Belgian polymath Adolphe Quetelet during the course of developing "social physics". Body mass index is defined as the individual's body mass divided by the square of his or her height. The formulae universally used in medicine produce a unit of measure of kg/m2. BMI can also be determined using a BMI chart, which displays BMI as a function of weight (horizontal axis) and height (vertical axis) using contour lines for different values of BMI or colors for different BMI categories.
BMI

BMI provided a simple numeric measure of a person's "thickness" or "thinness", allowing health professionals to discuss over- and under-weight problems more objectively with their patients. However, BMI has become controversial because many people, including physicians, have come to rely on its apparent numerical authority for medical diagnosis, but that was never the BMI's purpose; it is meant to be used as a simple means of classifying sedentary (physically inactive) individuals, or rather, populations, with an average body composition. For these individuals, the current value settings are as follows: a BMI of 18.5 to 25 may indicate optimal weight; a BMI lower than 18.5 suggests the person is underweight while a number above 25 may indicate the person is overweight; a person may have a BMI below 18.5 due to disease; a number above 30 suggests the person is obese (over 40, morbidly obese).
For a given height, BMI is proportional to mass. However, for a given mass, BMI is inversely proportional to the square of the height. So, if all body dimensions double, and mass scales naturally with the cube of the height, then BMI doubles instead of remaining the same. This results in taller people having a reported BMI that is uncharacteristically high compared to their actual body fat levels. In comparison, the Ponderal index is based on this natural scaling of mass with the third power of the height. However, many taller people are not just "scaled up" short people, but tend to have narrower frames in proportion to their height. Nick Korevaar (a mathematics lecturer from the University of Utah) suggests that instead of squaring the body height (as the BMI does) or cubing the body height (as the Ponderal index does), it would be more appropriate to use an exponent of between 2.3 and 2.7.
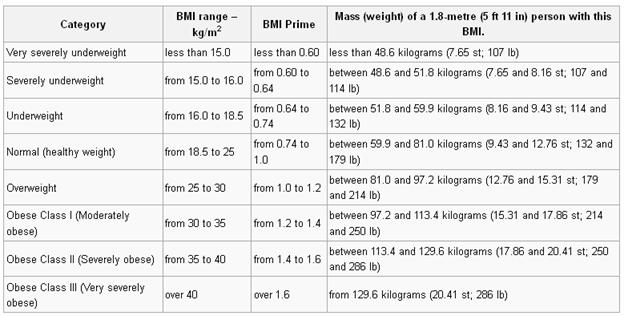
BMI Prime, a simple modification of the BMI system, is the ratio of actual BMI to upper limit BMI (currently defined at BMI 25). As defined, BMI Prime is also the ratio of body weight to upper body weight limit, calculated at BMI 25. Since it is the ratio of two separate BMI values, BMI Prime is a dimensionless number, without associated units. Individuals with BMI Prime < 0.74 are underweight; those between 0.74 and 0.99 have optimal weight; and those at 1.00 or greater are overweight. BMI Prime is useful clinically because individuals can tell, at a glance, by what percentage they deviate from their upper weight limits. For instance, a person with BMI 34 has a BMI Prime of 34/25 = 1.36, and is 36% over his or her upper mass limit. In Asian populations (see International Variation section below) BMI Prime should be calculated using an upper limit BMI of 23 in the denominator instead of 25. Nonetheless, BMI Prime allows easy comparison between populations whose upper limit BMI values differ.
A frequent use of the BMI is to assess how much an individual's body weight departs from what is normal or desirable for a person of his or her height. The weight excess or deficiency may, in part, be accounted for by body fat (adipose tissue) although other factors such as muscularity also affect BMI significantly (see discussion below and overweight). The WHO regards a BMI of less than 18.5 as underweight and may indicate malnutrition, an eating disorder, or other health problems, while a BMI greater than 25 is considered overweight and above 30 is considered obese. These ranges of BMI values are valid only as statistical categories.
BODY VOLUME INDEX (BVI)
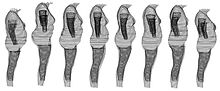
The Body Volume Index (BVI) is a new measurement for human obesity that has been proposed as an alternative to the Body Mass Index (BMI). BMI is based on a measurement of total mass, irrespective of the location of the mass, but BVI looks at the relationship between mass and volume distribution (i.e. where the body mass is located on the body). BMI is based on height and weight only, but the new BVI system automatically measures BMI, waist circumference and waist-hip ratio in addition to highly sophisticated volumetric and body composition analysis. BVI is an application that can be used on a 3D Full Body Scanner to determine individual health risk, whether the scanning hardware uses visible light optical information or otherwise. BVI allows for differentiation between people who are assigned the same BMI rating, but who have a different body shape and weight distribution, so that their individual BMI rating may not accurately reflect their own risk.
The BMI of a person is measured manually by total weight and height, BVI is calculated by using 3D full body data to determine volume or weight distribution. BVI measures where the weight and the fat are distributed on a person's body, rather than the total weight or total fat content. There has been an acceptance in recent years that abdominal fat and weight around the abdomen constitute a greater health risk, commonly known as central obesity. A full body surface scanner determines the three-dimensional outline of a person's exterior surface, so that computation can be used to calculate the part volumes and the part body composition of that person. BVI makes an inference as to the body's distribution of weight and the distribution of muscle and fat, using complex and detailed Body Composition data.
Eight women with the same BMI rating (BMI - 30) but with different weight distribution and abdominal volume, so they have different BVI ratings
Most 3D scanners suitable for BVI require that the subject is scanned for a series of images under varying lighting conditions (various projected patterns), to determine body shape and weight distribution data for individual patient and statistical analysis and BVI is currently under evaluation by government agencies in the UK as a possible long-term replacement for BMI.
ENERGY EXPENDITURE
The energy that is consumed in the form of food is required by the body for metabolic, cellular, and mechanical work such as breathing, heart beat, and muscular work, all of which require energy and result in heat production. The body requires energy for a variety of functions. The largest use of energy is needed to fuel the basal metabolic rate (BMR), which is the energy expended by the body to maintain basic physiological functions (e.g., heart beat, muscle contraction and function, respiration). BMR is the minimum level of energy expended by the body to sustain life in the awake state. It can be measured after a 12 hour fast while the subject is resting physically and mentally, and maintained in a thermoneutral, quiet environment. The BMR is slightly elevated above the metabolic rate during sleep, because energy expenditure increases above basal levels owing to the energy cost of arousal. Because of the difficulty in achieving BMR under most measurement situations, resting metabolic rate (RMR) is frequently measured using the same measurement conditions stated for BMR. Thus, the major difference between BMR and RMR is the slightly higher energy expended during RMR (~ 3%) owing to less subject arousal and nonfasting conditions. Because of this small difference, the terms basal and resting metabolic rate are often used interchangeably. RMR occurs in a continual process throughout the 24 hours of a day and remains relatively constant within individuals over time. In the average adult human, RMR is approximately 4.2 kJ/min. Thus, basal or resting metabolic rate is the largest component of energy expenditure and makes up about two-thirds of total energy expenditure.
In addition to RMR, there is an increase in energy expenditure in response to food intake. This increase in metabolic rate after food consumption is often referred to as the thermic effect of a meal (or mealinduced thermogenesis) and is mainly the energy that is expended to digest, metabolize, convert, and store ingested macronutrients, named obligatory thermogenesis. The measured thermic effect of a meal is usually higher than the theoretical cost owing to a facultative component caused by an activation of the sympathoadrenal system, which increases energy expenditure through peripheral β-adrenoceptors. The energy cost associated with meal ingestion is primarily influenced by the composition of the food that is consumed, and also is relatively stable within individuals over time. The thermic effect of a meal usually constitutes approximately 10% of the caloric content of the meal that is consumed. The third source of energy expenditure in the body is the increase in metabolic rate that occurs during physical activity, which includes exercise as well as all forms of physical activity. Thus, physical activity energy expenditure (or the thermic effect of exercise) is the term frequently used to describe the increase in metabolic rate that is caused by use of skeletal muscles for any type of physical movement. Physical activity energy expenditure is the most variable component of daily energy expenditure and can vary greatly within and between individuals owing to the volitional and variable nature of physical activity patterns.
In addition to the three major components of energy expenditure, there may be a requirement for energy for three other minor needs.
· The energy cost of growth occurs in growing individuals, but is negligible except within the fi rst few months of life.
· Adaptive thermogenesis is heat production during exposure to reduced temperatures, and occurs in humans, e.g., during the initial months of life and during fever and other pathological conditions, but also as a contributor to daily energy expenditure.
· Thermogenesis is increased by a number of agents in the environment, including in foods and beverages. Nicotine in tobacco is the most important one, and heavy smokers may have 10% higher energy expenditure than nonsmokers of similar body size and composition and physical activity. Caffeine and derivatives in coffee, tea, and chocolate, capsaicin in hot chilies, and other substances in foods and drinks may possess minor thermogenic effects that affect energy expenditure.
CONCEPT OF ENERGY EXPENDITURE
The process of energy expenditure and the oxidation or combustion of food for energy in the body is analogous to a woodstove that burns wood to release heat in a controlled fashion. In this analogy, large chunks of wood are fed to the stove and the wood is gradually combusted in the presence of oxygen to release carbon dioxide, water vapor, and heat. Similarly, in the body, the food consumed is oxidized or combusted in the presence of oxygen to release carbon dioxide, water, and heat. When ingested food is used for energy, however, the release and transfer of energy occur through a series of tightly regulated metabolic pathways in which the potential energy from food is released slowly and gradually over time. This process ensures that the body is provided with a gradual and constant energy store, rather than relying on a sudden release of energy from an immediate combustion of ingested food. As a simple example of how the body uses food for energy, consider the combustion of a simple glucose molecule:
C6H12O6 + 6O2 → 6H2O + 6CO2 + Heat
Similar chemical reactions can be described for the combustion of other sources of energy, such as fat and other types of carbohydrates. These types of reaction occur continuously in the body and constitute energy expenditure. As discussed previously, the three major sources of energy expenditure in the body are to fuel RMR, the thermic effect of meals, and physical activity. As discussed in more detail below, energy expenditure can be measured by assessment of total heat production in the body (direct calorimetry) or by assessment of oxygen consumption and carbon dioxide production (indirect calorimetry).
MEASUREMENT OF ENERGY EXPENDITURE
Lavoisier’s device was the first calorimeter that was used to measure heat production. This approach is termed direct calorimetry because heat production is measured directly. Direct calorimeters have been designed for measuring heat production in humans, but this approach is technically demanding, especially in human studies, and is now infrequently used.
Indirect calorimetry measures energy production via respiratory gas analysis. This approach is based on oxygen consumption and carbon dioxide production that occurs during the combustion (or oxidation) of protein, carbohydrate, fat, and alcohol, as shown in the example of glucose combustion. Respiratory gas analysis can easily be achieved in humans either over short measurement periods at rest or during exercise using a face mask, mouthpiece, or canopy system for gas collection, and over longer periods of 24 hours (and longer) with subjects living in a metabolic chamber. BMR is typically measured by indirect calorimetry under fasted conditions while subjects lie quietly at rest in the early morning for 30–40 min.
The thermic effect of a meal is typically measured by monitoring the changes in metabolic rate by indirect calorimetry for 3–6 hours following consumption of a test meal of known caloric content. The energy expended in physical activity can be measured under laboratory conditions, also using indirect calorimetry during standard activities. In addition, free-living physical activity-related energy expenditure over extended periods of up to 2 weeks can be measured by the combination of doubly labeled water (DLW) to measure total energy expenditure (see below), and indirect calorimetry to measure resting energy expenditure and the thermic effect of a meal. Indirect calorimetry has an added advantage in that the ratio of carbon dioxide production to oxygen consumption (the respiratory quotient, or RQ) is indicative of the type of substrate (i.e., fat versus carbohydrate) being oxidized, for example carbohydrate oxidation has a RQ of 1.0 and fat oxidation has a RQ close to 0.7.
Energy expenditure can be assessed from indirect calorimetry in a simple, less accurate way by ignoring the contribution of protein oxidation or by collecting urine during the measurement to analyze the excreted nitrogen. The latter approach is preferable because it gives a more accurate estimate of energy expenditure and RQ.
Step 1
First, the contribution of protein oxidation to oxygen consumption (VO2) and carbon dioxide production (VCO2) is estimated based on the knowledge that the nitrogen content of protein is 1/6.25:
VO2(prot) = n × 6.25 × 0.97
VCO2(prot) = n × 6.25 × 0.77
where V is volume, 0.97 and 0.77 are liters of O2 consumed and CO2 produced by the biological oxidation of 1 g of protein, respectively, and prot is protein.
Step 2
Next, nonprotein VO2 (VO2(nonprot)) and nonprotein VCO2 (VCO2(nonprot)) are calculated:
V O2(nonprot) = VO2 − VO2(prot)
V CO2(nonprot) = VCO2 − VCO2(prot)
VO2(nonprot) = C × 0.828 + F × 2.03
VCO2(nonprot) = C × 0.828 + F × 1.43
where C and F are grams of oxidized carbohydrate and fat, respectively, and can be found by solving the two equations with two unknowns; O2 and CO2 produced by the combustion of 1 g of carbohydrate is 0.828 liters, whereas the combustion of 1 g triglyceride consumes 2.03 liters O2 and produces 1.43 liters CO2. The protein oxidation (P) is n × 6.25 g.
Step 3
The RQ is defined as:
VCO2/VO2
Nonprotein RQ (RQ(nonprot)) is calculated by the equation:
RQ(nonprot) = VCO2(nonprot)/VO2(nonprot)
Step 4
Next, energy expenditure can be calculated:
Energy expenditure (kJ/min) = [19.63 + 4.59 (RQ(nonprot) − 0.707] × VO2(nonprot) + 18.78 × VO2(nonprot)
or
Energy expenditure (kJ/min) = 17 × P + 17.5 × C + 38.9 × F
where 17, 17.5, and 38.9 are the heat produced (kJ) by the combustion of 1 g of protein, glycogen, and triglyceride, respectively. The equations are produced by the insertion of the heat equivalent for carbohydrate and fat, and are valid even though there is a quantitative conversion of carbohydrate to lipid (de novo lipogenesis) or glyconeogenesis. The caloric equivalent for O2 is similar to the three main substrates: 21 kJ/l O2 for carbohydrate, 19 kJ/l O2 for fat, and 17.8 kJ/l O2 for protein (which contributes only modestly to energy expenditure). Energy expenditure can therefore be calculated with reasonable accuracy by the equation:
Energy expenditure (kJ/min) = 20 kJ/l × VO2 (l/min)
With pure fat oxidation the RQ is 0.707, with pure carbohydrate oxidation it is 1.0, and with pure protein oxidation it is approximately 0.8.
Step 5
Oxidation of protein (P), carbohydrate (C), and fat (F) can be calculated by the following equations, where n is the unit g/min:
P (g/min) = 6.25 × n
C (g/min) = 4.55 × VCO2 − 3.21 × VO2 − 2.87
F (g/min) = 1.67 × VO2 − 1.67 × VCO2 − 1.92 × n
TOTAL ENERGY EXPENDITURE: MEASUREMENT BY DOUBLY LABELED WATER
The integrated sum of all components of energy expenditure is termed total energy expenditure. Until recently, there was no good way to measure total energy expenditure in humans living under their habitual conditions. Total energy expenditure can be measured over 24 hours or longer in a metabolic chamber, but this environment is artificial and is not representative of the normal daily pattern of physical activity. The DLW technique can be used to obtain an integrated measure of all components of daily energy expenditure over extended periods, typically 7–14 days, while subjects are living in their usual environment. The technique was fi rst introduced in the 1950s as an isotopic technique for measuring the carbon dioxide production rate in small animals.
Unfortunately, it was not possible to apply the technique to humans because the dose required was cost prohibitive given the relatively poor sensitivity of the required instrumentation at that time. It was not for another 20 years that the inventors of this technique described the feasibility of applying the technique to measure free-living energy expenditure in humans, and 10 years later this concept became a reality.
The DLW method requires a person to ingest small amounts of “heavy” water that is isotopically labeled with deuterium and oxygen-18 (2H2O and H218O). These forms of water are naturally occurring, stable (nonradioactive) isotopes of water that differ from the most abundant form of water. In deuterium labeled water, the hydrogen is replaced with deuterium, which is an identical form of water except that deuterium has an extra neutron in its nucleus compared with hydrogen, and is thus a heavier form of water; similarly, 18O-labeled water contains oxygen with an additional two extra neutrons. Thus, these stable isotopes act as molecular tags so that water can be tracked in the body. After a loading dose, deuterium- labeled water is washed out of the body as a function of body water turnover; 18O is also lost as a function of water turnover, but is lost via carbon dioxide production as well. Therefore, using a number of assumptions, the rate of carbon dioxide production and energy expenditure can be assessed based on the different rates of loss of these isotopes from the body.
The major advantages of the DLW method are that the methodology is truly noninvasive and nonobtrusive (subjects are entirely unaware that energy expenditure is being measured), and measurement is performed under free-living conditions over extended periods (7–14 days). Moreover, when used in combination with indirect calorimetry for assessment of resting metabolic rate, physical activity-related energy expenditure can be assessed by the difference (i.e., total energy expenditure minus resting metabolic rate, minus the thermic effect of meals = physical activity energy expenditure). The additional power of assessing total energy expenditure with the DLW method is that this approach can provide a measure of total energy intake in subjects who are in energy balance. This is because, by definition, in a state of energy balance, total energy intake must be equivalent to total energy expenditure. This aspect of the technique has been used as a tool to validate energy intakes using other methods such as food records and dietary recall. For example, it has been known for some time that obese subjects report a lower than expected value for energy intake. At one time it was thought that this was due to low energy requirements in the obese due to low energy expenditure and reduced physical activity. However, using DLW, it has now been established that obese subjects systematically underreport their actual energy intake by 30–40% and actually have normal energy expenditure, relative to their larger body size.
The major disadvantages of the technique are the periodic nonavailability and expense of the 18O isotope (around —500–600 for a 70 kg adult), the need for and reliance on expensive equipment for analysis of samples, and that the technique is not well suited to large-scale epidemiological studies. Furthermore, although the technique can be used to obtain estimates of physical activity energy expenditure, it does not provide any information on physical activity patterns (i.e., type, duration, and intensity of physical activity periods during the day).
The DLW technique has been validated in humans in several laboratories around the world by comparison with indirect calorimetry in adults and infants. These studies generally show the technique to be accurate to within 5–10%, relative to data derived by indirect calorimetry for subjects living in metabolic chambers. The theoretical precision of the DLW technique is 3–5%. However, the experimental variability is ± 12% under free-living conditions, owing to fluctuations in physical activity levels, and ± 8% under more controlled sedentary living conditions. The good accuracy and reasonable precision of the technique therefore allow the DLW method to be used as a “gold standard” measure of free-living energy expenditure in humans against which other methods can be compared.
BASAL METABOLIC RATE
Basal metabolic rate (BMR) is the amount of energy expended while at rest in a neutrally temperate environment, in the post-absorptive state (meaning that the digestive system is inactive, which requires about twelve hours of fasting in humans). The release of energy in this state is sufficient only for the functioning of the vital organs, such as the heart, lungs, brain and the rest of the nervous system, liver, kidneys, sex organs, muscles and skin. BMR decreases with age and with the loss of lean body mass. Increasing muscle mass increases BMR. Aerobic fitness level, a product of cardiovascular exercise, while previously thought to have effect on basal or resting metabolic rate (RMR), has been shown in the 1990s not to correlate with BMR, when fat-free body mass was adjusted for. New research has however come to light which suggests aerobic exercise does increase resting energy consumption (see "Aerobic vs. anaerobic exercise"). Illness, previously consumed food and beverages, environmental temperature, and stress levels can affect one's overall energy expenditure as well as one's BMR.
BMR is measured under very restrictive circumstances when a person is awake, but at complete rest. An accurate BMR measurement requires that the person's sympathetic nervous system not be stimulated. A more common and closely related measurement, used under less strict conditions, is resting metabolic rate (RMR).
BMR and RMR are measured by gas analysis through either direct or indirect calorimetry, though a rough estimation can be acquired through an equation using age, sex, height, and weight. Studies of energy metabolism using both methods provide convincing evidence for the validity of the respiratory quotient (R.Q.), which measures the inherent composition and utilization of carbohydrates, fats and proteins as they are converted to energy substrate units that can be used by the body as energy. Studies conducted by Spennewyn in 1990 found strong correlations between lean mass and metabolism based on indirect calorimetry measurements. Spennewyn discovered that lean tissue in men and women required approximately 16 calories per pound per day. Thus, once a lean mass was known it could be multiplied by 16 to reveal daily caloric needs based on the activity level of the individual. This method has been used in many health club environments to determine daily caloric needs.
Nutrition and dietary considerations
Basal metabolic rate is usually by far the largest component of total caloric expenditure. However, the Harris-Benedict equations are only approximate and variation in BMR (reflecting varying body composition), in physical activity levels, and in energy expended in thermogenesis make it difficult to estimate the dietary consumption any particular individual needs in order to maintain body weight. 2000 calories is often quoted but is no more than a guideline.
Physiology
Both basal metabolic rate and resting metabolic rate are usually expressed in terms of daily rates of energy expenditure. The early work of the scientists J. Arthur Harris and Francis G. Benedict showed that approximate values could be derived using body surface area (computed from height and weight), age, and sex, along with the oxygen and carbon dioxide measures taken from calorimetry. Studies also showed that by eliminating the sex differences that occur with the accumulation of adipose tissue by expressing metabolic rate per unit of "fat-free" or lean body weight, the values between sexes for basal metabolism are essentially the same. Exercise physiology textbooks have tables to show the conversion of height and body surface area as they relate to weight and basal metabolic values.
The primary organ responsible for regulating metabolism is the hypothalamus. The hypothalamus is located on the brain stem and forms the floor and part of the lateral walls of the third ventricle of the cerebrum. The chief functions of the hypothalamus are:
Control and integration of activities of the autonomic nervous system (ANS)
Production and regulation of feelings of rage and aggression
Regulation of body temperature
Regulation of food intake
All of these functions taken together form a survival mechanism that causes us to sustain the body processes that BMR and RMR measure.
BMR ESTIMATION FORMULAE
Several prediction equations exist. Historically most notable was Harris-Benedict equation, which was created in 1919.
The original equations from Harris and Benedict are:
for men,
for women,
where P is total heat production at complete rest, m is the weight, h is the stature (height), and a is the age, and with the difference in BMR for men and women being mainly due to differences in body weight. For example, a 55 year old woman weighing 130 lb (59 kg) and 5 feet 6 inches (168 cm) tall would have a BMR of 1272 kcal per day or 53 kcal/h (61.3 watts).
It was the best prediction equation until recently, when MD Mifflin and ST St Jeor in 1990 created new equation:
where s is +5 for males and −161 for female. According to this formula, the woman in the example above has a BMR of 1208 kcal per day.
During the last 100 years, lifestyles have changed and a survey in 2005 showed it to be about 5% more accurate.
These formulae are based on body weight, which does not take into account the difference in metabolic activity between lean body mass and body fat. A more accurate formula is the Katch-McArdle formula based on lean body mass:
![]()
where LBM is the lean body mass in kg. According to this formula, if the woman in the example has a body fat percentage of 30%, her BMR would be 1263 kcal per day.
To calculate daily calorie needs, this BMR value is multiplied by a factor with a value between 1.2 and 1.9, depending on the person's activity level.
Biochemistry
About 70% of a human's total energy expenditure is due to the basal life processes within the organs of the body (see table). About 20% of one's energy expenditure comes from physical activity and another 10% from thermogenesis, or digestion of food (postprandial thermogenesis). All of these processes require an intake of oxygen along with coenzymes to provide energy for survival (usually from macronutrients like carbohydrates, fats, and proteins) and expel carbon dioxide, which is explained by the Krebs cycle.
What enables the Krebs cycle to perform metabolic changes to fats, carbohydrates, and proteins is energy which can be defined as the ability or capacity to do work. The breakdown of large molecules into smaller molecules associated with release of energy is catabolism. The building up process is termed anabolism. The breakdown of proteins into amino acids is an example of catabolism while the formation of proteins from amino acids is an anabolic process.
Exergonic reactions are energy-releasing reactions and are generally catabolic. Endergonic reactions require energy and include anabolic reactions and the contraction of muscle. Metabolism is the total of all catabolic, exergonic, anabolic, endergonic reactions.
Adenosine Triphosphate (ATP) is the intermediate molecule that drives the exergonic transfer of energy to switch to endergonic anabolic reactions used in muscle contraction. This is what causes muscles to work which can require a breakdown, and also to build in the rest period, which occurs during the strengthening phase associated with muscular contraction. ATP is composed of adenine, a nitrogen containing base, ribose, a five carbon sugar (collectively called adenosine), and three phosphate groups. ATP is a high energy molecule because it stores large amounts of energy in the chemical bonds of the two terminal phosphate groups. The breaking of these chemical bonds in the Krebs Cycle provides the energy needed for muscular contraction.
Energy expenditure breakdown liver 27% brain 19% heart 7% kidneys 10% skeletal muscle 18% other organs 19%
AEROBIC VS ANAEROBIC EXERCISE
Studies published in 1992 and 1997 indicate that the level of aerobic fitness of an individual does not have any correlation with the level of resting metabolism. Both studies find that aerobic fitness levels do not improve the predictive power of Fat Free Mass for resting metabolic rate. However, recent research suggests that endurance training does indeed result in an increase in energy consumption. A recent study has shown that the resting energy consumption of men who run for four hours a week is 54% higher than sedentary men.
This means it is unclear whether aerobic or anaerobic exercise are more effective in raising the resting metabolic rate (Basal Metabolic Rate). Anaerobic exercise, such as weight lifting, builds additional muscle mass, which is Fat Free Mass. Additional Fat Free Mass will lead to a higher resting metabolic rate according to the above studies. Also, while aerobic exercise is beneficial for cardiovascular reasons as well as direct calorie burning, recent studies seem to suggest that heavy endurance exercise also increases resting metabolism. However, it is unclear if light cardiovascular training has the same effect.
Longevity
In 1926 Raymond Pearl proposed that longevity varies inversely with basal metabolic rate (the "rate of living hypothesis"). Support for this hypothesis comes from the fact that mammals with larger body size have longer maximum life spans and the fact that the longevity of fruit flies varies inversely with ambient temperature. Additionally, the life span of houseflies can be extended by preventing physical activity.
But the ratio of resting metabolic rate to total daily energy expenditure can vary between 1.6 to 8.0 between species of mammals. Animals also vary in the degree of coupling between oxidative phosphorylation and ATP production, the amount of saturated fat in mitochondrial membranes, the amount of DNA repair, and many other factors that affect maximum life span.
HARRIS-BENEDICT EQUATION
The Harris-Benedict equation (also called the Harris-Benedict principle) is a method used to estimate the daily calorie requirements of an individual using their basal metabolic rate or BMR. The estimated value is then multiplied by a number that corresponds to the person's activity level. The resulting number is the recommended daily calorie intake to maintain current weight. The equation does not take into account calories burned by existing large amounts of muscle mass, nor does it account for the additional calories provided by excess body fat—so the equation is more effective for individuals at an ideal body weight or close to it. The Harris Benedict equation may be used to assist weight loss—by reducing the calorie intake to a number below the outcome of the equation.
Step 1- calculating the BMR
The following table enables calculation of an individuals Basal Metabolic Rate (BMR).
|
BMR calculation for men |
BMR = 66 + ( 13.7 x weight in kg ) + ( 5 x height in cm ) - ( 6.76 x age in years ) |
|
BMR calculation for men |
BMR = 66 + ( 6.23 x weight in pounds ) + ( 12.7 x height in inches ) - ( 6.76 x age in years ) |
|
BMR calculation for women |
BMR = 655 + ( 9.6 x weight in kg ) + ( 1.8 x height in cm ) - ( 4.7 x age in years ) |
|
BMR calculation for women |
BMR = 655 + ( 4.35 x weight in pounds ) + ( 4.7 x height in inches ) - ( 4.7 x age in years ) |
Step 2 - applying the Harris-Benedict Principle
The following table enables calculation of an individuals recommended daily calorie intake to maintain current weight:
|
Little to no exercise |
Daily calories needed= BMR x 1.2 |
|
Light exercise (1-3 days per week) |
Daily calories needed= BMR x 1.375 |
|
Moderate exercise (3-5 days per week) |
Daily calories needed= BMR x 1.55 |
|
Heavy exercise (6-7 days per week) |
Daily calories needed= BMR x 1.725 |
|
Very heavy exercise (twice per day, extra heavy workouts) |
Daily calories needed= BMR x 1.9 |
Applications for weight loss
Using the formulae above, a 24 year old, 175lb male who is 5'11 would have a BMR of 1894.75. If he exercised moderately, he would multiply his BMR by his activity level (1894.75 x 1.55) to determine daily calorie requirements, which would be 2937 calories per day to keep his weight at 175. This may seem like a high calorie intake- but his activity level accounts for the excess food intake. This individual would exercise normally but not lose weight. The same individual without the exercise routine would only be able to consume 2273 calories per day without gaining weight. The US Department of Health and Human Services Daily Value Guidelines provides figures that support the above example.
Using the Harris-Benedict Equation, individuals can take a mathematical approach to weightloss. There are 3500 calories in 1lb of body fat. Using the Harris Benedict Principle, if someone has a daily allowance of 2500 calories, but they reduce their intake to 2000, then the calculations show a 1 pound loss every 7 days.
RESPIRATORY QUOTIENT (RQ)
The respiratory quotient (or RQ or respiratory coefficient), is a dimensionless number used in calculations of basal metabolic rate (BMR) when estimated from carbon dioxide production. Such measurements, like measurements of oxygen uptake, are forms of indirect calorimetry. It is measured using Ganong's Respirometer.
RESPIROMETER
A respirometer is a device used to measure the rate of respiration of a living organism by measuring its rate of exchange of oxygen and/or carbon dioxide. They allow investigation into how factors such as age, chemicals or the effect of light affect the rate of respiration. Respirometers are designed to measure respiration either on the level of a whole animal (plant) or on the cellular level. These fields are covered by whole animal and cellular (or mitochondrial) respirometry, respectively.
A simple whole animal respirometer designed to measure oxygen uptake or CO2 release consists of a sealed container with the living specimen together with a substance to absorb the carbon dioxide given off during respiration, such as soda lime pellets or cotton wads soaked with potassium hydroxide. The oxygen uptake is detected by displacement of manometric fluid in a thin glass U-tube connected to the container. When the organism takes in oxygen it gives off an equal volume of carbon dioxide. As this is absorbed by the soda lime, air is sucked in from the U-tube to keep the pressure constant, displacing the liquid. The rate of change gives a direct and reasonably accurate reading for the organism's rate of respiration.
As changes in temperature or pressure can also affect the displacement of the manometric fluid, a second respirometer identical to the first except with a dead specimen (or something with the same mass as the specimen in place of the organism) is sometimes set up. Subtracting the displacement of the second respirometer from the first allows for control of these factors.
The set up of modern respirometers is described in more detail under respirometry. A Respirometer may also be called an oxygraph. Suppliers for whole animal respirometers are e.g. Sable Systems, Qubit Systems, or Challenge Technology; for mitochondrial respirometers Oroboros Instruments, Hansatech Instruments, or YSI.
CALCULATION
The respiratory quotient (RQ) is calculated from the ratio:
RQ = CO2 eliminated / O2 consumed
where the term "eliminated" refers to carbon dioxide (CO2) removed ("eliminated") from the body.
In this calculation, the CO2 and O2 must be given in the same units, and in quantities proportional to the number of molecules. Acceptable inputs would be either moles, or else volumes of gas at standard temperature and pressure (time units may be included, but they cancel out since they must be the same in numerator and denominator).
Many metabolized substances are compounds containing only the elements carbon, hydrogen, and oxygen. Examples include fatty acids, glycerol, carbohydrates, deamination products, and ethanol. For complete oxidation of such compounds, the chemical equation is
CxHyOz + (x + y/4 - z/2) O2 ---> x CO2 + (y/2) H2O
and thus metabolism of this compound gives an RQ of x/(x + y/4 - z/2).
The range of respiratory coefficients for organisms in metabolic balance usually ranges from 1.0 (representing the value expected for pure carbohydrate oxidation) to ~0.7 (the value expected for pure fat oxidation). A mixed diet of fat and carbohydrate results in an average value between these numbers. An RQ may rise above 1.0 for an organism burning carbohydrate to produce or "lay down" fat (for example, a bear preparing for hibernation).
RQ value corresponds to a caloric value for each liter (L) of CO2 produced. If O2 consumption numbers are available, they are usually used directly, since they are more direct and reliable estimates of energy production.
RQ as measured includes a contribution from the energy produced from protein. However, due to the complexity of the various ways in which different amino acids can be metabolized, no single RQ can be assigned to the oxidation of protein in the diet.
Glucose
Because the ratio of hydrogen to oxygen atoms in all carbohydrates is always the same as that in water — that is, 2 to 1 — all of the oxygen consumed by the cells is used to oxidize the carbon in the carbohydrate molecule to form carbon dioxide. Consequently, during the complete oxidation of a glucose molecule, six molecules of carbon dioxide are produced and six molecules of oxygen are consumed.
The overall equation for this reaction is:
C6H12O6 + 6 O2 → 6 CO2 + 6 H2O
Because the gas exchange in this reaction is equal, the respiratory quotient for carbohydrate is unity or 1.0:
R.Q. = 6 CO2 / 6 O2
Fats
The chemical composition for fats differs from that of carbohydrates in that fats contain considerably fewer oxygen atoms in proportion to atoms of carbon and hydrogen. When listed on nutritional information tables, fats are generally divided into six categories: total fats, saturated fatty acid, polyunsaturated fatty acid, monounsaturated fatty acid, dietary cholesterol, and trans fatty acid. From a basal metabolic or resting metabolic perspective, more energy is needed to burn a saturated fatty acid than an unsaturated fatty acid. The fatty acid molecule is broken down and categorized based on the number of carbon atoms in its molecular structure. The chemical equation for metabolism of the twelve to sixteen carbon atoms in a saturated fatty acid molecule shows the difference between metabolism of carbohydrates and fatty acids. Palmitic acid is a commonly studied example of the saturated fatty acid molecule.
The overall equation for the substrate utilization of palmitic acid is:
C16H32O2 + 23 O2 → 16 CO2 + 16 H2O
Thus the R.Q. for palmitic acid is 0.696:
R.Q. = 16 CO2 / 23 O2 = 0.696
The overall equation for the substrate utilization of palmitic acid is:
C16H32O2 + 23 O2 → 16 CO2 + 16 H2O
Thus the R.Q. for palmitic acid is 0.696:
R.Q. = 16 CO2 / 23 O2 = 0.696
Proteins
Proteins are composed of carbon, hydrogen, oxygen, and nitrogen arranged in a variety of ways to form a large combination of amino acids. Unlike fat the body has no storage deposits of protein. All of it is contained in the body as important parts of tissues, blood hormones, and enzymes. The structural components of the body that contain these amino acids are continually undergoing a process of breakdown and replacement. The respiratory quotient for protein metabolism can be demonstrated by the chemical equation for oxidation of albumin:
C72H112N2O22S + 77 O2 → 63 CO2 + 38 H2O + SO3 + 9 CO(NH2)2
The R.Q. for albumin is 63 CO2/ 77 O2 = 0.818
RESPIRATORY EXCHANGE RATIO (RER)
The ratio between the amount of CO2
exhaled and O2 inhaled in one breath is the respiratory exchange
ratio (RER). In one breath, humans normally breathe in more molecules of oxygen
(O2) than they breathe out molecules of carbon dioxide (CO2).
Measuring this ratio can be used for estimating the respiratory quotient (RQ),
an indicator of which fuel (carbohydrate or fat) is being metabolized to supply
the body with energy.
RER is about 0.8 at rest with a modern diet. This value however, can exceed 1 during intense exercise, as CO2 production by the working muscles becomes greater and more of the inhaled O2 gets used rather than being expelled. During exercise, using RER for estimating RQ loses accuracy because of factors including bicarbonate buffering of hydrogen ions, which affects the CO2 levels being expelled by the respiratory system. Calculation of RER is commonly done in conjunction with exercise tests such as the VO2 Max Test and can be used as an indicator that the participants are nearing exhaustion and the limits of their cardio-respiratory system. An RER greater than 1.1 is often used as a secondary endpoint criteria of a VO2 Max Test. An RER of 0.70 indicates that fat is the predominant fuel source, RER of 0.85 suggests a mix of fat and carbohydrates, and a value of 1.00 or above is indicative of carbohydrate being the predominant fuel source.
Summary of the metabolic basis for protein and amino acid requirements
It should be evident from this account of the underlying aspects of the needs for α-amino nitrogen and indispensable amino acids, that the “metabolic” requirement can usefully be divided: first, into those needs directly associated with protein deposition, a critical issue in infants, early childhood nutrition, and during recovery from prior depletion due to disease or malnutrition; and, second, into those needs associated with the maintenance of body protein balance, which accounts for almost all of the amino acid requirement in the healthy adult, except for that due to the turnover and loss of the various physiologically important nitrogen-containing products. Quantifying the minimum needs for nitrogen and for indispensable amino acids to support growth should be relatively easy, in principle, because these needs are simply the product of the rate of protein nitrogen deposition and the amino acid composition of the proteins that are deposited. Here, it may be pointed out that the gross amino acid composition of whole body proteins shows essentially no difference among a variety of mammals, including humans. Thus, at the major biochemical level the qualitative pattern of the needs of individual amino acids to support protein deposition would be expected to be generally similar.
In humans, in contrast to rapidly growing mammals such as the rat and pig, the obligatory amino acid needs for the purposes of net protein deposition are for most stages in life a relatively minor portion of the total amino acid requirement. Hence, most of the requirement for nitrogen and amino acids is associated with the maintenance of body protein stores (or body nitrogen equilibrium). A major portion of the maintenance nitrogen and amino acids needs is directly associated with protein metabolism and reflects two related factors.
● Amino acids released from tissue protein degradation are not recycled with 100% efficiency.
● Amino acid catabolism is a close function of the free amino acid concentration in tissues, and so the presence of the finite concentrations of free amino acids necessary to promote protein synthesis inevitably leads to some degree of amino acid catabolism and irreversible loss. The other metabolic component of the requirement for nitrogen and amino acids, is due to the turnover of functionally important products of amino acid metabolism, which are also necessary to maintain health. Although this may not necessarily be a major quantitative component of the daily requirement, it is qualitatively and functionally of considerable importance; health depends on the maintenance of this component of the protein need. Finally, four physiological systems appear to be critical for health: the intestine, to maintain absorptive and protective function; the immune and repairsystem and other aspects of defense; the skeletal musculature system; and the central nervous system. Within each system it is possible to identify critical metabolic roles for some specifi c amino acids (Table 4.7). Also of note is that, with certain exceptions (the involvement of phenylalanine and tryptophan in the maintenance of the adrenergic and serotinergic neurotransmitter systems, and methionine as a methyl group donor for the synthesis of creatine, as well as the branched-chain amino acids as nitrogen precursors for cerebral glutamate synthesis), the necessary precursors shown here are the dispensable and conditionally indispensable amino acids.
Protein requirements for various age and physiological groups
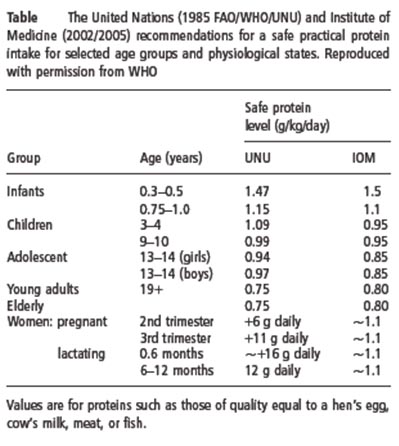
The protein requirements for young adult men and women have been based on both short- and longterm nitrogen balance studies. This also applies to healthy elderly people, whose protein requirements have been judged not to be different from those of younger adults. In order to make practical recommendations to cover the requirements for most individuals, it is necessary to adjust the average or mean requirement for a group by a factor that accounts for the variation in protein requirements among apparently similar individuals in that group. This factor is usually taken to be the coeffi cient of variation (CV) around the mean requirement and traditionally a value of 2 . CV (SD/mean) is added to the mean physiological requirement, so that the needs of all but 2.5% of individuals within the population would be covered. This adjusted requirement value is taken to be the safe practical protein intake for the healthy adult (Table 4.8). Most individuals would require less than this intake to maintain an adequate protein nutritional status.
It is worth emphasizing two points. First, the current UN recommendations shown in Table 4.8 apply to healthy individuals of all ages. However, it is highly likely that the needs of sick or less healthy patients would differ from and usually exceed those of healthy subjects. In this case, the values given in this table can be regarded only as a basis from which to begin an evaluation of how disease and stress, including surgery, affect the needs for dietary protein. Unfortunately, the quantitative needs for protein (total nitrogen) in sick, hospitalized patients can be only very crudely approximated at this time. Second, the values shown in Table 4.8 apply to high-quality food proteins, such as eggs, milk, meat, and fish.
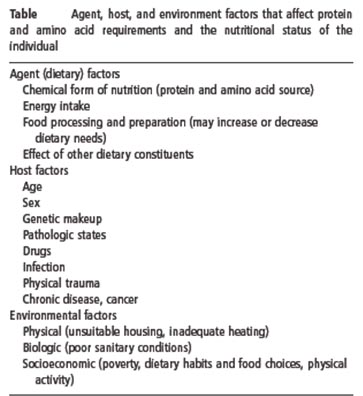
Factors other than diet affecting protein and amino acid requirements
Not everyone of the same age, body build, and gender has the same nutrient requirements. These differences may be due, in part, to variations in genetic background. Various environmental, physiological, psychological, and pathological infl uences affect the variability in physiological requirements for nutrients among individuals (Table 4.17). For example, as already discussed, the growing infant or child requires higher nutrient intakes per unit of body weight than does the adult. Besides energy, for which the daily requirement declines with age because of reduced physical activity, it appears that the nutrient needs of healthy aged subjects do not differ significantly from those of young adults. Nevertheless, a characteristicof aging is an increased incidence of disease and morbidity, which is likely to be far more important than age per se in determining practical differences between the nutrient requirements of younger adults and elderly people. Thus, superimposed infection, altered gastrointestinal function, and metabolic changes that often accompany chronic disease states would all be expected to reduce the efficiency of dietary nitrogen and amino acid utilization. The metabolic response to acute infection in healthy young men has been characterized in experiments involving different types of intracellular infection, and involves an increased loss of body nitrogen, together with increased losses of several other nutrients including potassium, magnesium, phosphorus, and vitamin C. This increased loss clearly implies increased needs for nitrogen, amino acids, and other nutrients. In addition to the catabolic response of body nitrogen metabolism to infection and trauma, there is a corresponding anabolic component that is of major importance during recovery from these stressful conditions.
Anabolic responses occur not only during recovery but also in the early phase of illness, when anabolism is associated with increased production of immunocompetent cells such as phagocytes and other leukocytes, and the induction of several tissue enzymes and immunoglobulins.
During recovery from infection two characteristics of the anabolic period that follows are that the increased nitrogen retention seen during this period is greater than that measured during the preincubation phase, and its duration is much longer than the catabolic period. This may be due, in part, to the effect of protein depletion antedating an acute episode, which may be the case in poor communities. However, in spite of the potential for disease states to increase protein and amino acid needs there are too few studies that help to assess precisely their quantitative influence on nutrient utilization and dietary requirements.
QUALITY OF PROTEIN
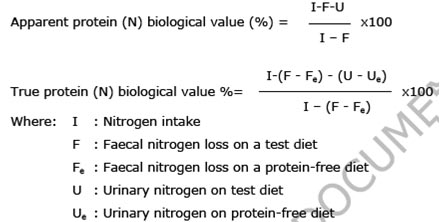
Another factor, which determines the daily protein requirement, is the absorption and the biological value of the dietary proteins. The digestibility the proportion of food protein which is absorbed, is computed from measurement of the nitrogen content of the food ingested and the nitrogen excreted in faeces, taking into account the extent to which faecal nitrogen is “endogenous” which, in turn, is measured as faecal nitrogen lost on a protein-free diet.
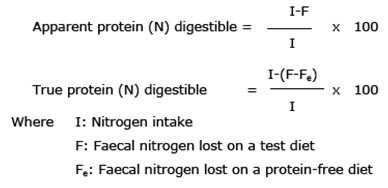
The amino acid profile is assumed to determine the effectiveness with which absorbed dietary N can be utilized which is usually defined in terms of biological value (BV) i.e.
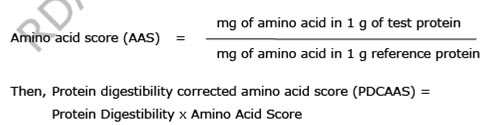
Protein quality can be determined by a purely biological method or by the amino acid profile as compared to that of a standard protein like egg or in comparison with that of requirement pattern. Earlier, egg protein amino acid composition was to be used for comparison. However, presently a comparison with the amino acid composition of requirement pattern is suggested. A comparison of the limiting amino acid content of the test protein should predict its quality or BV (i.e.) Amino acid score (AAS) is expressed as the ratio of mg of amino acid in 1 g of test protein to mg of amino acid in reference protein.
Considerable debate has taken place regarding issues surrounding protein intake requirements. The amount of protein required in a person's diet is determined in large part by overall energy intake, the body's need for nitrogen and essential amino acids, body weight and composition, rate of growth in the individual, physical activity level, individual's energy and carbohydrate intake, as well as the presence of illness or injury. Physical activity and exertion as well as enhanced muscular mass increase the need for protein. Requirements are also greater during childhood for growth and development, during pregnancy or when breast-feeding in order to nourish a baby, or when the body needs to recover from malnutrition or trauma or after an operation.
If enough energy is not taken in through diet, as in the process of starvation, the body will use protein from the muscle mass to meet its energy needs, leading to muscle wasting over time. If the individual does not consume adequate protein in nutrition, then muscle will also waste as more vital cellular processes (e.g. respiration enzymes, blood cells) recycle muscle protein for their own requirements. According to US & Canadian Dietary Reference Intake guidelines, women aged 19–70 need to consume 46 grams of protein per day, while men aged 19–70 need to consume 56 grams of protein per day to avoid a deficiency. The American and Canadian guidelines recommend a daily protein dietary allowance, measured as intake per kilogram body weight, is 0.8 g/kg. However, this recommendation is based on structural requirements, but disregards use of protein for energy metabolism. This requirement is for a normal sedentary person. Several studies have concluded that active people and athletes may require elevated protein intake (compared to 0.8 g/kg) due to increase in muscle mass and sweat losses, as well as need for body repair and energy source. Suggested amounts vary between 1.6 g/kg and 1.8 g/kg, while a proposed maximum daily protein intake would be approximately 25% of energy requirements i.e. approximately 2 to 2.5 g/kg.
Endurance athletes differ from strength-building athletes in that endurance athletes do not build muscle mass from training. Research suggests that individuals performing endurance activity require more protein intake than sedentary individuals so that muscles broken down during endurance workouts can be repaired. Although the protein requirement for athletes still remains controversial, research does show that endurance athletes can benefit from increasing protein intake because the type of exercise endurance athletes participate in still alters the protein metabolism pathway. The overall protein requirement increases because of amino acid oxidation in endurance-trained athletes. Endurance athletes who exercise over a long period (2–5 hours per training session) use protein as a source of 5–10% of their total energy expended. Therefore, a slight increase in protein intake may be beneficial to endurance athletes by replacing the protein lost in energy expenditure and protein lost in repairing muscles. Some scientists suggest that endurance athletes may increase daily protein intake to a maximum of 1.2–1.4 g per kg body weight.
Anaerobic exercise protein needs
Research also indicates that individuals performing strength-training activity require more protein than sedentary individuals. Strength-training athletes may increase their daily protein intake to a maximum of 1.4–1.8 g per kg body weight to enhance muscle protein synthesis, or to make up for the loss of amino acid oxidation during exercise. Many athletes maintain a high-protein diet as part of their training, and so protein deficiency is less likely among this group than among non-athletes. In fact, some athletes who specialize in anaerobic sports (e.g. weightlifting) assume a very high level of protein intake is necessary, and may over-consume. Research indicates that many athletes consume more protein than they need even without the use of protein supplements.
Dietary Fat: Chemistry and functions
Dietary fat (lipids) provides energy and essential fatty acids, serves as a vehicle for fat-soluble vitamins and facilitates their absorption. Since fat provides high energy value (9 kcal or 37.7kJ/g) as compared to carbohydrates or proteins (4 kcal or 16.7 kJ/ g), the fat content of a diet contributes significantly to its caloric density. Fat enhances texture, taste and flavour of food, reduces its gastric emptying and thereby affects satiety. During the past two decades, the nutritional and health consequences of dietary fat and its fatty acids have been shown to be more varied and detrimental in humans than was understood in the past.
Dietary fat consists of heterogeneous mixtures of triacylglycerols (triglycerides) and small proportions of phospholipids, glycolipids, monoacylglycerols, diacylglycerols and unsaponifiable fraction composed of fat soluble chemicals collectively designated as non-glyceride components. Fatty acids, the building blocks of various lipids, are classified into 3 groups: saturated fatty acids (SFAs), monounsaturated fatty acids (MUFAs) and polyunsaturated fatty acids (PUFAs). Most of the SFAs consisting of straight even-numbered chains of 4-24 carbon atoms are classified as short (<10:0), medium (12:0 and 14:0) or long (16:0-24:0) chain fatty acids. The double bonds in MUFAs and PUFAs can be either cis or trans relative to the plane of acyl chain while the nutritionally significant MUFAs and PUFAs have double bonds in cis configuration. Unsaturated fatty acids (MUFAs and PUFAs) containing one or more double bonds in trans configuration are called trans fatty acids (TFAs). PUFAs are grouped into two series (n-6 or n-3) depending on whether the double bond closest to the methyl end is located at C6 or C3 position. Humans can synthesize SFAs and MUFAs besides obtaining from the diet, while they cannot synthesize the parent PUFAs, namely, linoleic acid (LA, 18:2n-6) and alpha-linolenic acid (ALA, 18:3n-3). LA and ALA are dietary essential fatty acids, and are metabolized by consecutive chain elongase and desaturase enzymes to long chain (LC) n-6 PUFAs ( arachidonic acid (AA) is the predominant LC n-6 PUFA) and LC n-3 PUFAs {eicosapentaenoic acid (EPA) docosapentaenoic acid(DPA) and docosahexaenoic acid (DHA)} respectively (6.1). These are incorporated into the membrane lipids (6.1). The current human diets generally furnish high LA levels, low ALA levels and the conversion of ALA to LCn-3 PUFAs is slow and variable due to competitive interactions among LA, ALA and the various intermediates formed during their metabolism to LCPUFAs (6.1). Also several other nutritional and hormonal factors can influence the metabolism of LA and ALA to their respective LC PUFAs.
Recommended dietary allowances for Indians in 1990
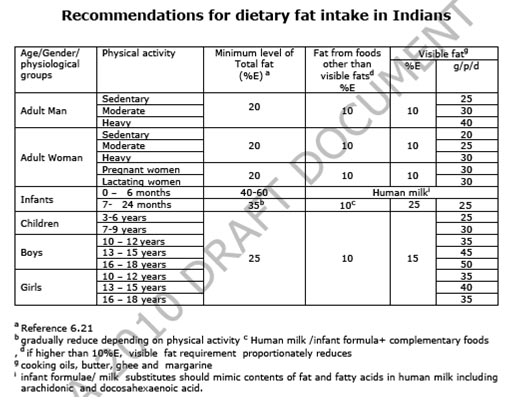
Earlier recommendations on fat requirement for Indians (6.22) considered the FAO/WHO 1977 recommendations (6.19) for i) total fat calories between 15-30%E and LA requirements for different groups (adult and children 3 %E, pregnant women 4.5 %E, lactating women 5.7 %E) ii) took into account the LA content from invisible fat, and arrived at a minimum level of 5 %E (12g/p/d) visible fat derived from oils having at least 20 % LA. Although a minimal intake of 12 g visible fat can meet LA requirement, a higher level of intake of 20g/day (10%E) was recommended to provide energy density and palatability to the diet. In pregnant and lactating women, a higher visible fat (30 and 45 g/p/d respectively) was recommended to provide higher level of LA and the necessary calorie density. In young children, ~15%E (25g/child) visible fat was recommended to provide adequate calorie density in their bulky cereal- based diets. Considering the amount of fat from all foods in the diets of urban high income group (10-15 %E), the upper limit of visible fat was estimated to be ~50g/p/day (<20 %E).
Quantity of visible fat
a) Minimum levels
Adults: Taking into account: i) ~10 % E fat from all foods except visible fats; average of ~7%E in rural India and 12 -14 %E in urban segments (6.23, 6.16, 6.27), ii) unfavourable effects of low fat-high carbohydrate diets (6.5-6.8) and iii) depending on energy requirements set on the basis of physical activity (Chapter 4, RDA 2009), the minimal intakes of visible fat in Indian adults range between 20-40 g/p/day (Table 6.4 ).
b) Maximum levels
In Table 6.4, minimum level of total fat (and visible fat ) in the diet is suggested. However, the maximum level of total fat (U-AMDR) that can be included in the diet should not exceed 30 %E (about 60g visible fat / day). Fat intake exceeding 35% E may increase the risk of DR-NCD and should be avoided. However, fat intake in the daily diet can be between 20-30%E
Quality of fat
a) Type of visible fat
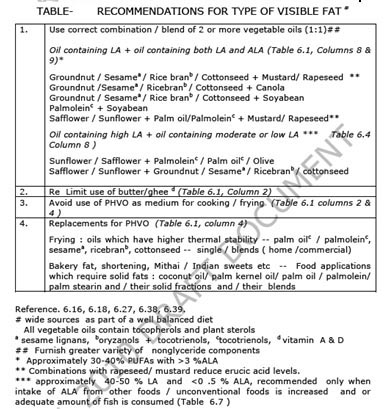
The quantity and fatty acid composition of both visible fat and fat from all other foods (invisible fats) contribute to the intake of various fatty acids in the total diet. The data on fatty acid intake in Indian adults determined by taking into account the contribution of various fatty acids from all foods (invisible fat) and either 20g or 50g visible fats ( in diets of either rural or urban population respectively) shows that a complete dependence on just one vegetable oil does not ensure the recommended intake of fatty acids for optimal health and prevention of DR-NCD (6.23, 6.27). Therefore, to ensure optimal fat quality, the use of correct combination of vegetable oils (table 6.5) is recommended (6.23, 6.27). A long term ‘in home‘ study with oil combinations (which increase ALA) showed improvement of LC n-3 PUFA nutritional status in adults (6.33). The types of visible fat to be preferred for different food applications are summarized in Table 6.5
b) Quality of total fat from dietary components other than visible fats
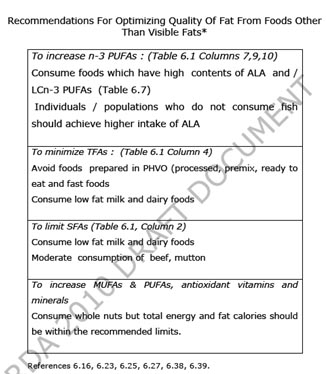
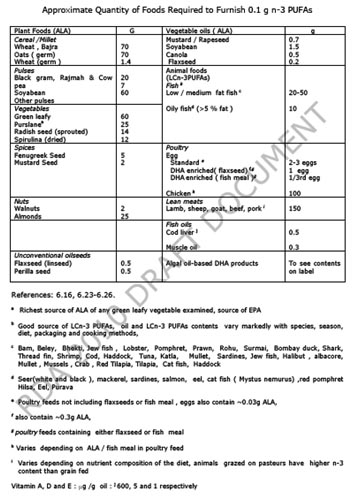
The recommendations to ensure fat quality from foods other than visible fats (fats present as integral component of foods and ‘hidden‘ fats from processed foods etc) are given in tables 6.6 and 6.7. Inclusion of LCn-3 PUFAs in diets is recommended for the prevention of DR-NCD and life-long health and well being. However, individuals/populations who, for various reasons, do not prefer to eat fish and other sea foods should ensure higher intake of ALA (table 6.7). Another alternative is to consume either fish oils or algal oils.
Nutritional requirements of carbohydrates
There are two types of carbohydrates - starchy (complex) carbohydrates and simple sugars. The simple sugar's are found in confectionery, muesli bars, cakes and biscuits, cereals, puddings, soft drinks and juices and jam and honey but they also contain fat. Starchy carbohydrates are found in potatoes, rice, bread, wholegrain cereals, semi skimmed milk, yoghurt, fruit, vegetables, beans and pulses. Both types effectively replace muscle glycogen. The starchy carbohydrates are the ones that have all the vitamins and minerals in them as well as protein. They are also low in fat as long as you do not slap on loads of butter and fatty sauces. The starchy foods are much more bulky so there can be a problem in actually eating that amount of food so supplementing with simple sugar alternatives is necessary.
Your digestive system converts the carbohydrates in food into glucose, a form of sugar carried in the blood and transported to cells for energy. The glucose, in turn, is broken down into carbon dioxide and water. Any glucose not used by the cells is converted into glycogen - another form of carbohydrate that is stored in the muscles and liver. However, the body's glycogen capacity is limited to about 350 grams; once this maximum has been reached, any excess glucose is quickly converted into fat. Base your main meal with the bulk on your plate filled with carbohydrates and small amounts of protein such as meat, poultry and fish. The extra protein & vitamins you may require will be in the starchy carbohydrates.
Carbohydrates are one of the four major classes of biomolecules and play several important roles in all life forms, including:
● sources of metabolic fuels and energy stores
● structural components of cell walls in plants and of the exoskeleton of arthropods
● parts of RNA and DNA in which ribose and deoxyribose, respectively, are linked by N-glycosidic bonds to purine and pyrimidine bases
● integral features of many proteins and lipids (glycoproteins and glycolipids), especially in cell membranes where they are essential for cell–cell recognition and molecular targeting.
Carbohydrates are very diverse molecules that can be classified by their molecular size (degree of polymerization or DP) into sugars (DP 1–2), oligosaccharides (DP 3–9), and polysaccharides (DP > 9). The physicochemical properties of carbohydrates and their fates within the body are also influenced by their monosaccharide composition and the type of linkage between sugar residues. From birth, carbohydrate provides a large part of the energy in human diets, with approximately 40% of the energy in mature breast milk being supplied as lactose. After weaning, carbohydrates are the largest source (40–80%) of the energy in many human diets, with most of this derived from plant material except when milk or milk products containing lactose are consumed. The carbohydrate contents of some vegetable dishes are summarized in Table 5.2.
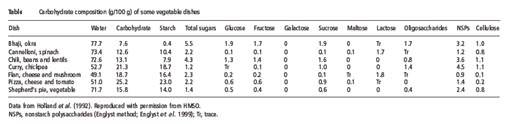
Dietary Fiber
Carbohydrates for Performance
Following training & competition, an athlete's glycogen stores are depleted. In order to replenish them the athlete needs to consider the speed at which carbohydrate is converted into blood glucose and transported to the muscles. The rapid replenishment of glycogen stores is important for the track athlete who has a number of races in a meeting. The rise in blood glucose levels is indicated by a food's Glycaemic Index (GI) - the faster and higher the blood glucose rises the higher the GI. High GI foods take 1 to 2 hours to be absorbed and low GI foods can take 3 to 4 hours to be absorbed. Studies have shown that consuming high GI carbohydrates (approximately 1grm per kg body) within 2 hours after exercise speeds up the replenishment of glycogen stores and therefore speeds up recovery time. Glycogen stores will last for approximately 10 to 12 hours when at rest (sleeping) so this is why breakfast is essential. Eating 5-6 meals or snacks a day, will help maximise glycogen stores and energy levels, minimise fat storage and stabilise blood glucose and insulin levels.
|
Circumstance |
Carbohydrate Requirement1 |
Grams for an athlete with 160 lbs. LBM |
|
Physiological Requirement |
0 g/day |
0 g/day |
|
PracticalMinimum to Avoid Muscle Breakdown2 |
50 g/day |
50 g/day |
|
Practical Minimum for Individuals Who Function Poorly In Ketosis3 |
100-120 g/day |
100-120 g/day |
|
Additional Amount to Sustain Low Intensity Exercise |
Minimal approaching zero |
Minimal approaching zero |
|
Additional Amount Needed to Sustain Weight Training |
5 g carbs. per 2 work sets4 |
5 g carbs. per 2 work sets4 |
|
Average Recommendations in Bodybuilding Nutrition |
1-3 g/lb. |
160-480 g/day |
|
Average Recommendations by Mainstream Nutritionists |
2-3 g/lb |
320-480 g/day |
|
Average Intake for Endurance Athletes |
2 g/lb |
320 g/day |
|
Recommended Intake for Endurance Athletes |
3-4.5 g/lb |
480-720 g/day |
|
Practical Maximum for Non-Carb Loading Individuals |
4 g/lb |
640 g/day |
|
Maximal Intakes for Carb-Loading |
~7 g/lb |
1120 g/day |
The nutrients that provide your body energy are known as macro nutrients. There are three key macro nutrients: protein, carbohydrates and fat. According to the United States Department of Agriculture's Dietary Reference Intakes, your body needs about 10 to 35 percent of your calories from protein, 20 to 35 percent from fat and the remaining 45 to 65 percent from carbohydrates. If you significantly reduce your protein or carbohydrate percentages you can suffer a variety of nutritional problems even if you're getting enough calories.
According to the United States Department of Agriculture's Dietary Reference Intake, you need about 45 to 65 percent of your daily calories from carbohydrates, making it the single largest macro nutrient in your diet. Carbohydrates provide energy in the form of glucose, and your body can store them in your muscles and liver to use at a later time. If you don't get enough carbohydrates this can lead to an abnormally low glucose level, known as hypoglycemia. Hypoglycemia can lead to confusion, seizures and loss of consciousness.
Your body uses protein in every cell and organ, and getting enough is key to maintaining a healthy diet. The United States Department of Agriculture recommends you get 10 to 35 percent of your daily caloric intake from protein. If you don't get enough proteins from your diet you can experience symptoms that include a decreased ability to heal wounds, swelling in your hands, feet or abdomen, decreased muscle mass and fatigue.
NUTRITIONAL DISEASES
Nutritional diseases are diseases in humans that are directly or indirectly caused by a lack of essential nutrients in the diet. Nutritional diseases are commonly associated with chronic malnutrition. Additionally, conditions such as obesity from overeating can also cause, or contribute to, serious health problems. Excessive intake of some nutrients can also cause acute poisoning.
Protein–energy malnutrition (or protein–calorie malnutrition) refers to a form of malnutrition where there is inadequate protein intake.
Types include:
Protein–energy malnutrition affects children the most because they have less protein intake. The few rare cases found in the developed world are almost entirely found in small children as a result of fad diets, or ignorance of the nutritional needs of children, particularly in cases of milk allergy.
KWASHIORKOR
Kwashiorkor is an acute form of childhood protein-energy malnutrition characterized by edema, irritability, anorexia, ulcerating dermatoses, and an enlarged liver with fatty infiltrates. The insufficient protein consumption, but with sufficient calorie intake, distinguishing it from marasmus. Kwashiorkor cases occurs in areas of famine or poor food supply. Breast milk contains proteins and amino acids vital to a child's growth. In at-risk populations, kwashiorkor may develop after a mother weans her child from breast milk, replacing it with a diet high in carbohydrates, especially starches, but deficient in protein.
The defining sign of kwashiorkor in a malnourished child is pedal oedema (swelling of the feet). Other signs include a distended abdomen, an enlarged liver with fatty infiltrates, thinning hair, loss of teeth, skin depigmentation and dermatitis. Children with kwashiorkor often develop irritability and anorexia. Victims of kwashiorkor fail to produce antibodies following vaccination against diseases, including diphtheria and typhoid. Generally, the disease can be treated by adding protein to the diet; however, it can have a long-term impact on a child's physical and mental development, and in severe cases may lead to death.
Kwashiorkor is a form of malnutrition that is deficient in protein. The low protein intake lead to the specific signs: edema of the hands and feet, irritability, anorexia, a desquamative rash, hair discoloration, and a large fatty liver. The typical swollen abdomen is due to two causes: ascites because of hypoalbuminemia (low oncotic pressure), and enlarged fatty liver.
Protein should be supplied only for anabolic purposes. The catabolic needs should be satisfied with carbohydrate and fat. Protein catabolism involves the urea cycle, which is located in the liver and can easily overwhelm the capacity of an already damaged organ. The resulting liver failure can be fatal. This means in patients suffering from kwashiorkor, protein must be introduced back into the diet gradually.
MARASMUS
Marasmus is a form of severe malnutrition characterized by energy deficiency. A child with marasmus looks emaciated. Body weight may be reduced to less than 80% of the average weight that corresponds to the height. Marasmus occurrence increases prior to age 1, whereas kwashiorkor occurrence increases after 18 months. It can be distinguished from kwashiorkor in that kwashiorkor is protein wasting with the presence of edema.
The malnutrition associated with marasmus leads to extensive tissue and muscle wasting, as well as variable edema. Other common characteristics include dry skin, loose skin folds hanging over the buttocks (glutei) and armpit (axillae), etc. There is also drastic loss of adipose tissue (body fat) from normal areas of fat deposits like buttocks and thighs. The afflicted are often fretful, irritable, and voraciously hungry.
Marasmus is generally known as the gradual wasting away of the body due to severe malnutrition or inadequate absorption of food. Marasmus is a form of severe protein deficiency and is one of the forms of protein-energy malfunction (PEM). It is a severe form of malnutrition caused by inadequate intake of proteins and calories.
Marasmus is caused by a severe deficiency of nearly all nutrients, especially protein and carbohydrates.
It is necessary to treat not only the symptoms but also the complications of the disorder, including infections, dehydration, and circulation disorders, which are frequently lethal and lead to high mortality if ignored.
Ultimately, marasmus can progress to the point of no return when the body's machinery for protein synthesis, itself made of protein, has been degraded to the point that it cannot handle any protein. At this point, attempts to correct the disorder by giving food or protein are futile.
MENTAL RETARDATION
Mental retardation (MR) is a generalized disorder appearing before adulthood, characterized by significantly impaired cognitive functioning and deficits in two or more adaptive behaviors. It has historically been defined as an Intelligence Quotient score under 70. Once focused almost entirely on cognition, the definition now includes both a component relating to mental functioning and one relating to individuals' functional skills in their environment. As a result, a person with a below-average intelligence quotient (BAIQ) may not be considered mentally retarded. Syndromic mental retardation is intellectual deficits associated with other medical and behavioral signs and symptoms. Non-syndromic mental retardation refers to intellectual deficits that appear without other abnormalities.
The signs and symptoms of mental retardation are all behavioral. Most people with mental retardation do not look like they have any type of intellectual disability, especially if the disability is caused by environmental factors such as malnutrition or lead poisoning. The so-called "typical appearance" ascribed to people with mental retardation is only present in a minority of cases, all of which involve syndromic mental retardation.
Children with mental retardation may learn to sit up, to crawl, or to walk later than other children, or they may learn to talk later. Both adults and children with mental retardation may also exhibit some or all of the following characteristics:
Malnutrition is a common cause of reduced intelligence in parts of the world affected by famine, such as Ethiopia.
According to the latest edition of the Diagnostic and Statistical Manual of Mental Disorders (DSM-IV), three criteria must be met for a diagnosis of mental retardation: an IQ below 70, significant limitations in two or more areas of adaptive behavior (as measured by an adaptive behavior rating scale, i.e. communication, self-help skills, interpersonal skills, and more), and evidence that the limitations became apparent before the age of 18.
By most definitions mental retardation is more accurately considered a disability rather than a disease. MR can be distinguished in many ways from mental illness, such as schizophrenia or depression. Currently, there is no "cure" for an established disability, though with appropriate support and teaching, most individuals can learn to do many things. Thus, adequate intake of proteins, fats and carbohydrates might reduce the severity of mental retardation if it is caused by malnutrition.
NUTRIENT REQUIREMENT AND RECOMMENDED DIETARY ALLOWANCES (RDA)
Dietary Standards
Dietary standards, regardless of the name they go by – Recommended Dietary Allowances, Recommended Nutrient Intakes, Recommended Daily Amounts of Nutrients, or Safe Intakes of Nutrients – are the average daily amounts of essential nutrients estimated, on the basis of available scientific knowledge, to be sufficiently high to meet the physiological needs of practically all healthy persons in a group with specified characteristics.
The first attempt to set standards for nutrient intakes was by the Food and Nutrition Board of the National Research Council of the USA in 1941, which published recommended daily allowances (RDAs) in 1943 to “provide standards to serve as a goal for good nutrition.” The first UK RDAs followed in 1950, published by the British Medical Association, and many other countries and international agencies now publish dietary standards that are intended to allow the adequacy of the nutrient intakes of groups or populations to be assessed by comparison with the standards.
Some internationally used terminologies can be mentioned. In 2007 UNU in collaboration with WHO, FAO and others convened a group to harmonise nutrient-based dietary standards. They decided that the term Nutrient Intake Values (NIV) should include, Average Nutrient Requirement (ANR) and Upper Nutrient Limit (UNI). ANR + 2SD which would cover 98% of the population refers to terms like RDI, RDA and Reference Nutrient Intake (RNI) (Ref. Food and Nutrition Bulletin 2001, 2007); ANR refers to values that cover 50% of the population and in Korean this value is Estimated Average Requirement (EAR) when it is derived on the basis of available scientific knowledge. For nutrients where such evidence is not there, the term Average Intake (AI) is used.
Dietary Reference Intakes – Definitions
Recommended Dietary Allowance (RDA): the average daily dietary nutrient intake level sufficient to meet the nutrient requirement of nearly all (97 to 98 percent) healthy individuals in a particular life stage and gender group.
Adequate Intake: a recommended average daily intake level based on observed or experimentally determined approximations or estimates of nutrient intake by a group (or groups) of apparently healthy people, that are assumed to be adequate — used when an RDA cannot be determined. In the Indian context, this is referred to as acceptable Intake.
Tolerable Upper Intake Level (UL): the highest average daily nutrient intake level that is likely to pose no risk of adverse health effects for almost all individuals in the general population. As intake increases above the UL, the potential risk of adverse effects increases.
Estimated Average Requirement (EAR): the average daily nutrient intake level estimated to meet the requirement of half of the healthy individuals in a particular life stage and gender group.
The RDA is derived from (i) the individual variability, and (ii) the nutrient bio-availability from the habitual diet.
Individual variability: Definition of RDA takes into account the variability that exists in the requirement of a given nutrient between individuals in a given population group. The distribution of nutrient requirement in a population group is considered normal and the RDA corresponds to a requirement, which covers most of the individuals (97.5%) in a given population. This corresponds to Mean + 2 SD. This is termed as a safe level of intake of a nutrient, that is, the chances of individuals having requirements above the RDA is only 2.5%. This principle is used in case of all nutrients except energy, since in the case of energy, intakes either the excess or below the actual requirement of energy are not safe. In case of other nutrients the RDA is 25% (+ 2SD) higher than the mean requirement, 12.5% being considered as the extent of individual variability in the requirements of all those nutrients.
Bio-availability: Bio-availability of a given nutrient from a diet, that is, the release of the nutrient from the food, its absorption in the intestine and bioresponse have to be taken into account. It is the level of the nutrient that should be present in the diet to meet the requirement. This bio-availability factor is quite important in case of calcium and protein and trace elements like iron and zinc. In case of iron, the amount to be present in the diet is 20-30 times higher than the actual iron requirement to account for the low bio-availability of iron from a given diet, particularly a cereal-based diet.
RDA represents the level of the nutrient to be consumed daily to meet all the requirements of most of the individuals in a given population. However, it must be recognized that RDA is not meant to be used as standard to determine whether or not a given individual requirement has been met, since it is a level above the requirement of most individuals in a given population. RDA value of a nutrient is valid only when all other dietary nutrient intakes are satisfactory.
Methods used to determine requirements
Deprivation studies
This is the most direct method and involves removing the nutrient from the diet, observing the symptoms of deficiency, and then adding back the nutrient until the symptoms are cured or prevented. Difficulties with this approach are as follows. First, which the experiment may need to continue for several years owing to the presence of body stores of the nutrient, and often requires a very limited and therefore boring dietary regimen. Second, unpredicted long-term adverse consequences may result. Third, such experiments are not ethical in vulnerable groups such as children (often the most relevant for study). In some cases, epidemiological data may be available; for example, the deficiency disease beriberi occurs in populations whose average thiamin intake falls below 0.2 mg/4.2 MJ (1000 kcal).
Radioactive tracer studies
This approach makes use of a known amount of the radioactively labeled nutrient, which is assumed to disperse evenly in the body pool, allowing the estimation of the total pool size by dilution of the isotope in samples of, for instance, plasma or urine (i.e., if the body pool is large, then the dilution will be greater than if the body pool is small). Specific activity, that is radioactivity per unit weight of the nutrient in the samples, can be used to calculate pool size as long as the total dose administered is known. The rate of loss can then be monitored by taking serial samples, allowing calculation of the depletion rate. In the case of vitamin C, the average body pool size of a healthy male was found to be 1500 mg, which, on a vitamin C-free diet, depleted at a rate of approximately 3% (of the body pool) per day. This fractional catabolic rate was independent of body pool size, and symptoms of scurvy appeared when the body pool fell below 300 mg. The estimated replacement intake needed to maintain the body pool above 300 mg was therefore 3% of 300 mg, i.e., 9 mg (similar to the 10 mg found to be needed to prevent scurvy in the earlier Sheffield experiment).
Balance studies
These rely on the assumption that, in healthy individuals of stable body weight, the body pool of some nutrients (e.g., nitrogen, calcium, and sodium) remains constant. Compensation mechanisms equalize the intake and output of the nutrient over a wide range of intakes, thereby maintaining the body pool. Thus, day-to-day variations of intake are compensated for by changes in either the rate of absorption in the gut (generally in the case of those nutrients of which the uptake is regulated) or the rate of excretion in the urine (in the case of very soluble nutrients) or feces, or both. However, there comes a point beyond which balance cannot be maintained; therefore, it can be proposed that the minimum intake of a nutrient at which balance can be maintained is the subject’s minimum required intake of that nutrient. However, this approach would need to be extended over time to investigate possible adaptive responses to reduced intakes, e.g., absorption could eventually be increased. In the case of calcium, the European consensus is that average daily losses are assumed to be 160 mg/day in adults, and absorption is assumed to be 30%; thus, around 530 mg would need to be consumed to balance the losses. Adding or subtracting 30% to allow for individual variation (the notional 2 SDs explained above) gives (rounded) dietary reference values of 400, 550 and 700 mg/day (LTI, AR, and PRI, respectively).
Factorial methods
These are predictions, rather than measurements, of the requirements of groups or individuals, taking into account a number of measured variables (factors, hence “factorial”) and making assumptions where measurements cannot be made. For example, the increased requirements during growth, pregnancy, or lactation are calculated by this method; this approach is necessitated by the lack of experimental data in these physiological situations owing to ethical problems. The idea is that the rate of accumulation of nutrients can be calculated and hence the amount required in the diet to allow that accumulation can be predicted. In the case of pregnancy, the requirement is estimated to be the amount of the nutrient needed to achieve balance when not pregnant plus the amount accumulated daily during the pregnancy, all multiplied by a factor accounting for the efficiency of absorption and assimilation (e.g., 30% for calcium). For lactation, the calculation for energy is based on the amount in the milk secreted daily, which is increased by a factor accounting for the efficiency of conversion from dietary energy to milk energy (reckoned to be 95%), from which total is subtracted an allowance for the contribution from the extra fat stores laid down during pregnancy, which it is desirable to reduce in this way. The difficulty with this approach is that the theoretical predictions do not necessarily take account of physiological adaptations (e.g., increased efficiency of absorption in the gut) that may reduce the predicted requirement. This would apply particularly in the case of pregnancy, as shown by the ability of women to produce normal babies even in times of food shortage.
Perspectives on the future
As the amount known about human requirements and nutrient functions increases, so too will the complexity of dietary recommendations. It is probable that further dietary components will be included in dietary recommendations as research data accumulate. Potential candidates include the flavonoids and some other antioxidant compounds. Furthermore, continuing research and the development of more informed interpretations of the expanding body of data available necessitate the regular revision and updating of the recommendations. The general conclusion that can be drawn here is that no single criterion of nutrient status can be used to define human requirements for all nutrients. This is not surprising when one considers the range of roles that the different essential nutrients play in humans.