GENOME DATABASES (NCBI, EBI, TIGR, SANGER)
SANGER INSTITUTE:
The Wellcome Trust Sanger Institute is a charitably funded genomic research centre located in Hinxton, nine miles south of Cambridge in the UK. The website address is http://www.sanger.ac.uk/.
A leader in the Human Genome Project, we are now focused on understanding the role of genetics in health and disease. Our passion for discovery drives our quest to uncover the basis of genetic and infectious disease. We aim to provide results that can be translated into diagnostics, treatments or therapies that reduce global health burdens. The Sanger Institute is a genome research institute primarily funded by the Wellcome Trust. The Sanger Institute deals with many enquiries from the public, media and researchers every day. The address is contact@sanger.ac.uk.
The Genome Campus is a 55-acre estate south of Cambridge in the grounds of Hinxton Hall. Nestled in the quiet countryside of these landscaped gardens, are two world-class research facilities: the Sanger Institute and the European Bioinformatics Institute (EBI). The Wellcome Trust bought the site in 1994 as a home for the new Sanger Centre. Since then the site has developed to become the British hub of biomedical science. As one of the largest sequencing centres in the world for more than 15 years, the Wellcome Trust Sanger Institute has produced more than 100 finished genomes. All can be accessed from the link http://www.sanger.ac.uk/resources/downloads/.
Genomic research generates data on a massive scale and methods to manage and interpret large-scale data are essential to translation of research into biological understanding. The Wellcome Trust Sanger Institute has developed - often with colleagues outside the institute - a suite of databases to help researchers.
The Sanger Institute contributed almost one-third of the sequence to the Human Genome Project, which was completed in 2003. This was the largest single contribution and the Sanger Institute was the only UK institution involved. The complete sequence is freely and publicly available and provides a priceless resource for all genetic research into human health and disease.
Bioinformatics, the application of computer power to understanding biology, is integral to modern genetic research and developing understanding of health and disease. Together with the European Bioinformatics Institute (EBI), the Sanger Institute developed, launched and maintains one of the world's most important genomic resources: The Ensembl Genome Browser. The Ensembl project has been crucial in coping with the increasing output of sequence data that can be generated using new sequencing platforms.
The Sanger Institute played an important role in the International HapMap Project, which provided researchers with a map on which they could locate genes affecting health, disease, and response to pharmaceuticals and environmental factors. We also led the Copy Number Variation Project, which revealed, for the first time, the extent of structural variation in the human genome. The Institute plays a lead role in the 1000 Genomes project, set up in 2008 to view variations in DNA at a high resolution. Collaborations such as these among scientists and among funding agencies are essential if global resources of this scale are to be developed. Researchers also examine the biology of human genetic variants in zebrafish or mouse models. Humans share 95 per cent of their DNA with mice and 89 per cent with zebrafish. Using these organisms, model human diseases determined to develop biological understanding.
The Institute for Genomic Research (TIGR) database:
http://www.jcvi.org/ or http://www.tigr.org/
TIGR Database maintained at the Institute for Genomic Research. The TIGR Database (TDB) is being developed as a collection of molecular biology databases comprising DNA and protein sequence, gene expression, function, cellular role, isology class, taxonomic and sample collection data. The first database available through TDB is Sequences, Sources, Taxa (SST).
The J. Craig Venter Institute was formed in October 2006 through the merger of several affiliated and legacy organizations�The Institute for Genomic Research (TIGR) and The Center for the Advancement of Genomics (TCAG), The J. Craig Venter Science Foundation, The Joint Technology Center, and the Institute for Biological Energy Alternatives (IBEA). Today all these organizations have become one large multidisciplinary genomic-focused organization. With more than 300 scientists and staff, more than 250,000 square feet of laboratory space, and locations in Rockville, Maryland and San Diego, California, the new JCVI is a world leader in genomic research.
For more than two decades Dr. J. Craig Venter and his research teams have been pioneers in genomic research. The revolution began in 1991 when at the National Institutes of Health Dr. Venter and his team developed expressed sequence tags (ESTs), a new technique to rapidly discover genes. Dr. Venter and his colleagues then started a new kind of not-for-profit research institute, The Institute for Genomic Research (TIGR). With the freedom to pursue any number of exciting avenues in the burgeoning field of genomics, the team decided to use their new computing and computational tools, as well as new DNA sequencing technology, to sequence the first free living organism, Haemophilus influenzae in 1995. With this advance, the floodgates of genomics were opened. TIGR went on to sequence and analyze more than 50 microbial genomes. Dr. Venter and some from his team moved into mammalian genomics and sequenced some of the most important model organisms including the fruit fly, mouse and rat. The world's attention was perhaps most keenly focused on the sequencing and analysis of one genomethe humanwhich was published in 2001 by Dr. Venter and his team at Celera Genomics.
At the JCVI, we're not content to rest on our laurels. In the past three years teams have been engaged in some of the most fruitful and exciting research in the biological sciences. We've published the first diploid human genome and the ongoing Global Ocean Sampling Expedition which has thus far uncovered more than 60 million genes and thousands of novel protein families from organisms found in sea water. Teams have also sequenced the microbial flora found in human environments such as the vagina, oral cavity and human gut. We're making steady progress in our quest to create a synthetic chromosome and organism having successfully transformed one species of bacteria into another. We've also sequenced a variety of important infectious disease agents such as the mosquito species, Aedes aegypti, and we are working to understand the evolution of several viral genomes such as influenza and coronavirus in our quest to help alleviate the scourge of infectious disease around the world. These are just a few of the many research areas our team is tackling as we seek to make a worldwide impact with our science.
The availability of the highly accurate genome sequences of Arabidopsis and rice, along with the draft genome sequences that have been generated such as for the poplar genome (http://genome.jgi-psf.org/Poptr1/Poptr1.home.html), or in progress such as those of sorghum (http://www.jgi.doe.gov/ sequencing/why/CSP2006/sorghum.html), a moss (http://www.jgi.doe.gov/sequencing/why/ CSP2005/physcomitrella. html) and a spikemoss (http://www.jgi.doe.gov/sequencing/why/ CSP2005/selaginella.html), has created the opportunityto perform comparative genomics studies among a broad variety of plants. All of the plant genomes previously selected for sequencing are relatively small. Large plant genomes pose a big challenge for genome sequencing owing to their high level of repetitiveness and frequent polyploidy. This sequencing limitation has so far excluded most economically important crops and key plant model systems from comprehensive genome analysis.
TIGR Maize database: (http://maize.tigr.org or http://maize.jcvi.org/)
Maize is a staple crop of the grass family and also an excellent model for plant genetics. Owing to the large size and repetitiveness of its genome, we previously investigated two approaches to accelerate gene discovery and genome analysis in maize: methylation filtration and high C0t selection. These techniques allow the construction of gene-enriched genomic librariesbyminimizing repeatsequences dueto either their methylation status or their copy number, yielding a 7-fold enrichment in genic sequences relative to a random genomic library. Approximately 900 000 gene-enriched reads from maize were generated and clustered into Assembled Zea mays (AZM) sequences. Here we report the current AZM release, which consists of _298 Mb representing 243 807 sequence assemblies and singletons. In order to provide a repository of publicly available maize genomic sequences, we have created the TIGR Maize Database (http://maize.tigr.org). In this resource, we have assembled and annotated the AZMs and used available sequenced markers to anchor AZMs to maize chromosomes. We have constructed a maize repeat database and generated draft sequence assemblies of 287 maize bacterial artificial chromosome (BAC) clone sequences, which we annotated along with 172 additional publicly available BAC clones. All sequences, assemblies and annotations are available at the project website via web interfaces and FTP downloads (ftp://ftp.tigr.org/pub/data/MAIZE/). The contact address is maize@tigr.org.
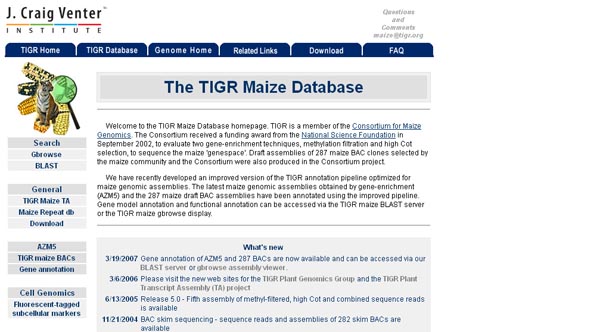
We have recently developed an improved version of the TIGR annotation pipeline optimized for maize genomic assemblies. The latest maize genomic assemblies obtained by gene-enrichment (AZM5) and the 287 maize draft BAC assemblies have been annotated using the improved pipeline. Gene model annotation and functional annotation can be accessed via the TIGR maize BLAST server or the TIGR maize gbrowse display.
TIGR Plant Repeat database:
http://plantrepeats.plantbiology.msu.edu/index.html or http://www.tigr.org/tdb/e2k1/plant.repeats/
In a number of higher plants, a substantial portion of the genome is composed of repetitive sequences that can hinder genome annotation and sequencing efforts. To better understand the nature of repetitive sequences in plants and provide a resource for identifying such sequences, we constructed databases of repetitive sequences for 12 plant genera:Arabidopsis, Brassica, Glycine, Hordeum, Lotus, Lycopersicon, Medicago, Oryza, Solanum, Sorghum, Triticum and Zea. The repetitive sequences within each database have been coded into superclasses, classes and sub-classes based on sequence and structure similarity. These databases are available for sequence similarity searches as well as downloadable �les either as entire databases or subsets of each database. To further the utility for comparative studies and to provide a resource for searching for repetitive sequences in other genera within these families, repetitive sequences have been combined into four databases to represent the Brassicaceae, Fabaceae, Gramineae and Solanaceae families. Collectively, these databases provide a resource for the identification, classification and analysis of repetitive sequences in plants.
Several modes of access are available for the TIGR Plant Repeat Databases. All databases, the four family databases, the 12 HTGS/PLANT-division-derived genera-specific databases, and the 10 GSS-division-derived genera-specific databases are available for BLAST searching at http://tigrblast.tigr.org/euk-blast/index.cgi?project=plant.repeats. All of these databases (26 in total) can be downloaded through anonymous FTP as a flat file (ftp://ftp.tigr.org/pub/data/TIGR_Plant_Repeats/).
NCBI Genome (http://www.ncbi.nlm.nih.gov/sites/genome/):
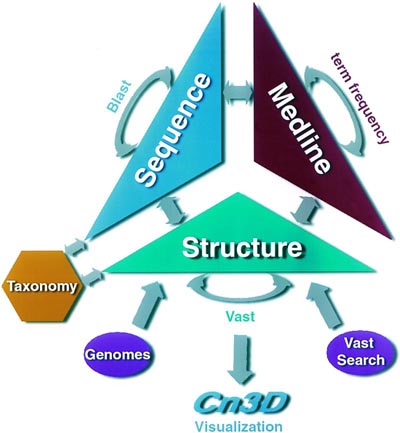
The National Center for Biotechnology Information (NCBI) is one of the world's premier Web sites for biomedical and bioinformatics research. Based within the National Library of Medicine at the National Institutes of Health, USA, the NCBI hosts many databases used by biomedical and research professionals. The services include PubMed, the bibliographic database; GenBank, the nucleotide sequence database; and the BLAST algorithm for sequence comparison, among many others.
The Genome database contains sequence and map data from the whole genomes of over 1000 species or strains. The genomes represent both completely sequenced genomes and those with sequencing in-progress. All three main domains of life (bacteria, archaea, and eukaryota) are represented, as well as many viruses, phages, viroids, plasmids, and organelles. This resource organizes information on genomes including sequences, maps, chromosomes, assemblies, and annotations.
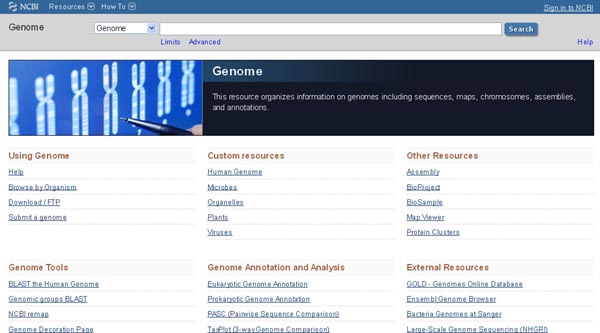
Genome database contains 9023 total genome of different organisms (Eukaryotes (2298), Prokaryotes (15572), viruses (3471)). Genomes can be accessed using browse by organism search option in addition to the entrez search tool. Genomic tools like Human genome Blast, Genomic group Blast for microbes, NCBI remap and Genome decoding page are available in NCBI genome database.
NCBI Remap is a tool that allows users to project annotation data from one coordinate system to another. This remapping (sometimes called 'liftover') uses genomic alignments to project features from one sequence to the other. For each feature on the source sequence, a base by base analysis peromed of each feature on the source sequence in order to project the feature through the alignment to the new sequence. NCBI Remap support three variations of Remap. Assembly-Assembly allows the remapping of features from one assembly to another. RefSeqGene allows for the remapping of features from assembly sequences to RefSeqGene sequences (including transcript and protein sequences annoted on the RefSeqGene) or from RefSeqGene sequences to an assembly (Clinical remap). Alt loci remap allows for the mapping of features between the Primary assembly and the alternate loci and Patches available for GRC assemblies.
The Genome Decoration Page (GDP) is a service that allows users to upload their own annotation data and create a figure showing that annotation distributed on the genome. Annotation can be shown as a track, or set of tracks, drawn next to the chromosome. One annotation track can be selected to be drawn as an 'Overlay', such that the annotation information is drawn on top of the chromosome representation.
The tbl2asn, a command-line program, automates the creation of sequence records for submission to GenBank using many of the same functions as Sequin. It is used primarily for submission of complete genomes and large batches of sequences and is available by FTP for use on MAC, PC and Unix platforms. Submissions made with tbl2asn must be mailed to gb-sub@ncbi.nlm.nih.gov. The ftp site for download is ftp://ftp.ncbi.nlm.nih.gov/genomes/.
Genome Projects (http://www.ncbi.nlm.nih.gov/genomeprj) collects information on complete and in-progress large-scale sequencing, assembly, annotation, and mapping projects for cellular organisms. The database is organized as a set of organism-specific overviews that allow browsing and retrieving specific projects for that organism.
EBI Genome:
The European Bioinformatics Institute (EBI) is an academic research institute located on the Wellcome Trust Genome Campus in Hinxton near Cambridge (UK), part of the European Molecular Biology Laboratory (EMBL). The mission of EBI is to provide freely available data and bioinformatics services to all facets of the scientific community in ways that promote scientific progress, to contribute to the advancement of biology through basic investigator-driven research in bioinformatics, to provide advanced bioinformatics training to scientists at all levels, from PhD students to independent investigators and to help disseminate cutting-edge technologies to industry.
Building on more than 20 years' experience in bioinformatics, the EMBL-EBI maintains the world's most comprehensive range of molecular databases. They are the European node for globally coordinated efforts to collect and disseminate biological data. Many of their databases are household names to biologists � they include EMBL-Bank (DNA and RNA sequences), Ensembl (genomes), ArrayExpress (microarray-based gene-expression data), UniProt (protein sequences), InterPro (protein families, domains and motifs) and PDBe (macromolecular structures). Others, such as IntAct (protein�protein interactions), Reactome (pathways) and ChEBI (small molecules), are new resources that help researchers to understand not only the molecular parts that go towards constructing an organism, but how these parts combine to create systems. The details of each database vary, but they all uphold the same principles of service provision.
There are three databases regarded as genome database at EBI. They are
ENA genome server (Complete genomes) (http://www.ebi.ac.uk/genomes/)
The first completed genomes from viruses, phages and organelles were deposited into the EMBL Database in the early 1980's. Since then, molecular biology's shift to obtain the complete sequences of as many genomes as possible combined with major developments in sequencing technology resulted in hundreds of complete genome sequences being added to the database, including Archaea, Bacteria and Eukaryota.
Ensembl: (http://www.ensembl.org/index.html)
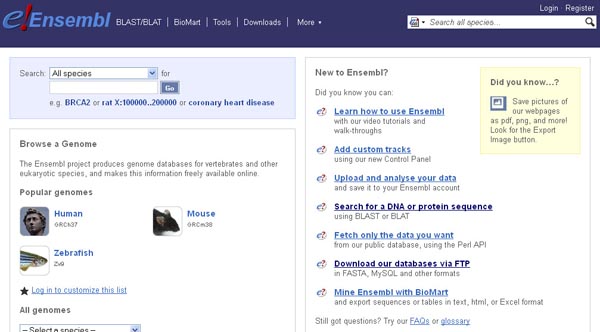
The genome sequence of an organism provides a natural index for organizing and understanding biological data. The Ensembl project provides a comprehensive genome information system consisting of data storage, integration, analysis and visualization of a wide variety of biological data. Ensembl�s primary focus is around providing gene annotation and comparative genome integration for chordate genomes, the vast majority of which are vertebrates. Ensembl concentrates particularly on mammalian genomes having developed initially around the human genome sequence. The Ensembl project (http://www.ensembl.org) is a comprehensive genome information system featuring an integrated set of genome annotation, databases, and other information for chordate, selected model organism and disease vector genomes. As of release 51 (November 2008), Ensembl fully supports 45 species, and three additional species have preliminary support. New species in the past year include orangutan and six additional low coverage mammalian genomes. Major additions and improvements to Ensembl since our previous report include a major redesign of our website; generation of multiple genome alignments and ancestral sequences using the new Enredo-Pecan-Ortheus pipeline and development of our software infrastructure, particularly to support the Ensembl Genomes project (http://www.ensemblgenomes.org/). Assembly converter, ID history converter, Region reporter, Variant effect predictor and Ensembl virtual machine are available tools at ensembl database. Ensembl database downloaded from the site ftp://ftp.ensembl.org/pub/.
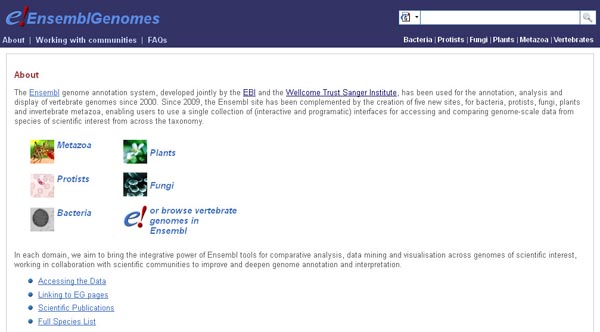
Ensembl genomes: (http://www.ensemblgenomes.org/).
Since 1995, when the genome of a cellular organism was completely sequenced for the first time, genome sequencing has transformed the biological sciences. Today, in excess of 1000 genomes have been sequenced, assembled, annotated and deposited in the public nucleotide archives; numerous other genomes exist in states of partial assembly and annotation; thousands of viral genomes sequences have also been generated. Moreover, the increasing use of high-throughput sequencing technologies is rapidly reducing the cost of genome sequencing, leading to an accelerating rate of data production. This not only makes it likely that in the near future,
The �Ensembl Genomes�, a new resource recently launched by the EBI to complement Ensembl by providing access to genome-scale data from non-vertebrate species through the same user interfaces as Ensembl. There are two big advantages of this approach. First, the Ensembl software system has evolved in response to new data types that have frequently first appeared in human genomic studies, but which are now increasingly appearing in the context of other species; its re-use provides a cost-effective way of providing sophisticated data analysis and visualisation tools for a wider range of genomes. Secondly, the use of a common system for all genomes greatly decreases the cost of broad range comparative genomics and other interspecies data analysis. For example, since the launch of Ensembl Genomes, data from malarial parasites (genus Plasmodium, available through Ensembl Protists), the malarial vector (Anopheles gambiae, available through Ensembl Metazoa), and the human host (in Ensembl) can now be accessed through a common set of interfaces.
Ensembl Genomes (http://www.ensemblgenomes.org) consists of separate portals for each of five distinct domains of life: bacteria, protists, fungi, plants, and invertebrate metazoa. Each site contains data for selected species from within their domain, chosen for their scientific interest. Information is available about each species, including the assembly version and annotation methods used the overall composition of the genome, etc. These have been customised for the species in Ensembl Genomes; for example, in Ensembl Bacteria, a circular view of the genome is provided, and the top-level pages have been designed to provide structured access to the large numbers of similar strains that have been sequenced in many clades. The main functionality offered by the portals is access to a graphical view of each genome, using the Ensembl genome browser software. The browser offers a number of views of locations in the genome, genes, and specific transcripts; tabs at the top of the page allow users to switch between these different levels, while a context-dependent left hand menu offers access to a selection of data views specific to each. The main display then appears in the central panel. Users can integrate their own analyses into appropriate displays by using the Distributed Annotated System (DAS).
Specific views exist for expression data, SNPs and other polymorphisms, and comparative genomics. With each new data release, the browser software is updated to a recent version, ensuring that a consistent user experience is provided between Ensembl and Ensembl Genomes. Release frequency is four to six times a year, tied to Ensembl releases where practical. In addition, Ensembl Genomes data is available through a number other routes. These include (i) query optimised data warehouses [built using the BioMart data warehousing system] that can be accessed through a variety of interfaces including SOAP-based and RESTful web services (ii) a publicly accessible relational database server offering direct access to all Ensembl Genomes databases and which supports a Applications Programming Interface (API) for the Perl programming language (iii) an FTP site where data can be downloaded in bulk. DNA and protein sequence similarity search is provided using BLAST. These routes of access match those available for vertebrate data in Ensembl; all data is available for re-use without restriction. As Ensembl software is also freely distributed, users can also establish their own local mirrors, and view confidential data in the context of the public reference. In each of the Ensembl Genomes sectors, comparative analysis is provided using the Ensembl Compara pipeline previously applied to vertebrate genomes and their outliers in Ensembl. The Ensembl browser is a powerful tool for genome analysis and visualisation, but it was conceived with a relatively small number of vertebrate genomes in mind. The ftp site is ftp://ftp.ensemblgenomes.org/pub/plants/.
METABOLIC PATHWAY DATABASE (KEGG, EMP, ECOCYC, BIOCYC AND METACYC)
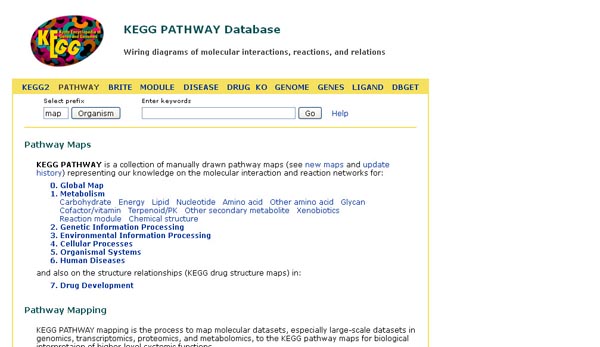
KEGG PATHWAY:
The website for the KEGG Pathway database is http://www.genome.jp/kegg/pathway.html. The ftp site for downloading KEGG Pathway database is ftp://ftp.genome.jp/pub/tools/dbget/. All the KEGG data are freely available to academic users by anonymous FTP (http://www.genome.ad.jp/anonftp/).
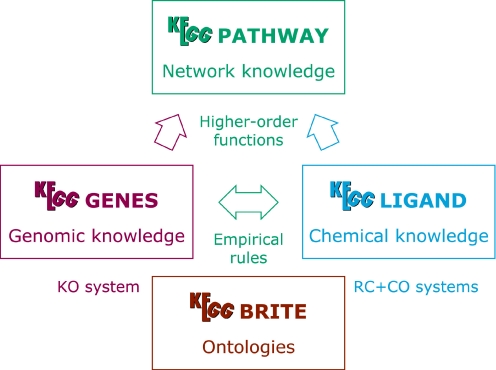
The GenomeNet (http://www.genome.ad.jp/) was established in September 1991 under the Human Genome Program of the then Ministry of Education, Science and Culture of Japan as a network of databases and computational services for genome research and related research areas in molecular and cellular biology. The GenomeNet is currently operated by the Bioinformatics Center of Kyoto University focusing more on functional genomics and proteomics but still supporting most of the major molecular biology databases. The primary resource of the GenomeNet is the Kyoto Encyclopedia of Genes and Genomes (KEGG). The KEGG project was initiated in May 1995, aimed at understanding the basic principles, as well as practical utilities, of the relations between genomic information and higher order functional information.
The KEGG/PATHWAY database contains reference diagrams for molecular pathways and complexes involving various cellular processes, which can readily be integrated with genomic information. A key to this integration is graph representation. Mathematically, a graph is a set of nodes and a set of edges.
The KEGG PATHWAY database is a collection of manually drawn pathway maps for metabolism, genetic information processing, environmental information processing such as signal transduction, various other cellular processes and human diseases. For metabolic pathways two new sections were created, �Glycan Biosynthesis and Metabolism� and �Biosynthesis of Polyketides and Nonribosomal Peptides�. The XML version of the pathway maps is available for both metabolic and regulatory pathways. These KEGG Markup Language (KGML) files provide graph information that can be used to computationally reproduce and manipulate KEGG pathway maps.
As of 7 September 2001 the PATHWAY database contains 5761 entries including 201 reference pathway diagrams and 83 ortholog group tables, as well as 14 960 enzyme�enzyme relations. The total number of gene product nodes that appear on the KEGG pathways is approximately 6000, and roughly one-quarter to one-third of the genes in a bacterial or archaeal genome can be mapped to one or more pathway diagrams. The total number of genes in the KEGG ortholog group tables is approximately 26 000, which is ∼10% of the total number of genes in the GENES database. At present (1st January 2013), 434 (215,095) entries are present in KEGG Pathway.
The network information of the KEGG/PATHWAY database is hierarchically categorized into four levels. According to our view on the hierarchy and modularity of cellular functions, the top level is categorized into metabolism, genetic information processing, environmental information processing, and the rest named cellular processes. In addition, a new top category of human diseases is being introduced. The third level corresponds to a pathway diagram and/or an ortholog group table, which is a collection of genes and proteins. The PATHWAY database can best be viewed by following this hierarchy top-down in the KEGG table of contents page (http://www.genome.ad.jp/kegg/kegg2.html) where the top level item of metabolism is designated by �Metabolic pathways� and the rest of the top level items are designated by �Regulatory pathways�. Alternatively, the hierarchy may be used bottom-up starting from the KEGG gene catalogs for individual organisms. In addition, the text information describing PATHWAY entries can be searched by the DBGET/LinkDB system.
The KEGG databases are updated daily. The information about KEGG pathway might be obtained by sending feedback at http://www.genome.jp/feedback/.
GenomeNet provides various computational services (http://www.genome.ad.jp/SIT/), including sequence similarity searches by BLAST and FASTA against all major sequence databases that are updated daily, and sequence motif search by MOTIF, which is an in-house-developed search system, against major motif libraries.
Enzymes and Metabolic Pathways (EMP):
The Enzymes and Metabolic Pathways (EMP) database is an electronic compilation of enzymatic and metabolic data from over 15,000 literature sources covering over 1800 different organisms. The Metabolic Pathways Database (MPW) is a derivative of the larger EMP database containing over 3000 pathway diagrams of primary and secondary metabolism, membrane transport, signal transduction, intracellular traffic, translation, and transcription. The assembly of the encoded data and of the pictorial pathway diagrams is an ongoing project centered at the Laboratory of Mathematical Simulation of Multienzyme Systems at the Institute of Theoretical and Experimental Biophysics of the Russian Academy of Sciences, in Pushchino, Russia. These resources can be accessed free of charge by academic and nonprofit users at http://www.empproject.com.
The database can be queried by means of a whole text search, taxonomy search, by accession number (i.e., a unique key that identifies a record), or by enzyme commission (EC) number. Pathway maps include not only the stoichiometry of the metabolic pathways, but also the substrate and coen-zyme specificity of their enzymes, their subcellular locations, required prosthetic groups and cofactors, and the taxonomic occurrence of the pathways. All pathway names are generated in the format substrates-products_function_(coen-zymes)_(locations)_[comment].

Figure shows the MPW-generated pathway diagram for glutathione biosynthesis named L-glutamate, L-cysteine_glutathione anabolism (ATP) (cytosol). This pathway was also used as an example in the last issue's Web site review of the EcoCyc and MetaCyc databases. As is the case with the EcoCyc and MetaCyc pathways, each compound or reaction number in the MPW pathways is linked to additional information. On the other hand, unlike the EcoCyc pathways which focus solely on the metabolism of Escherichia coli, species-specific regulatory structure information is not available through MPW.
A nomenclature for pathways
Early in the EMP project, it became clear that it was necessary to develop a nomenclature of metabolic pathways, and rules for generating systematic names were formulated. This was necessary to manage such a large collection (which will grow to contain thousands of pathways and variations of pathways). This nomenclature allows those wishing to restructure the collection or to write a browser for the collection to have access to a compact representation of the function of the pathway. The systematic name contains the initial substrates, final products, the function of the pathway, coenzymes, and cellular location of the pathway enzymes. Every metabolic pathway record includes this characteristic systematic pathway name. In addition, each record includes a shorter, but still unequivocal, recommended pathway name. Finally, a set of common names for the pathway are also encoded.
A brief description of the systematic name would appear as
Substrates�Products_Function_(Coenzymes)_(Locations)_[Comment]
For example, one of the versions of the Entner�Doudoroff Pathway encoded in the database is characterized by the name
D-glucose�pyruvate_catabolism_(ATP,_NADP(�+),_NAD(�+),_ADP)_(cytosol)
while the recommended name would be
Glucose�pyruvate_catabolism_[via D�glucono�1 ,5�lactone_6�phosphate]
and the common name would be
Entner�Doudoroff pathway.
It should be noted that a number of pathways in the collection (those encoded early in the project) do not strictly conform to the above conventions, and we are attempting to correct omissions as quickly as possible.
Downloadable demo versions of EMP are available via anonymous FTP. The collection of metabolic pathways described in this article is publicly available (free of charge) via anonymous FTP. For further information, send an empty electronic mail message (or one containing the single word INFO) to emp_info@biobase.com. Those who do not have access to electronic mail may write to Biological Databases Inc., 2004 South Wright Street, Urbana, IL 61801, USA.
Biocyc:
The website address is http://biocyc.org/. BioCyc is developed by the Bioinformatics Research Group at SRI International, directed by Dr. Peter Karp. The BioCyc collection of Pathway/Genome Databases (PGDBs) provides an electronic reference source on the genomes and metabolic pathways of sequenced organisms. BioCyc PGDBs are generated by software that predicts the metabolic pathway complements of completely sequenced organisms from their genome sequences. Furthermore, BioCyc PGDBs include the results of a number of other computational inference procedures applied to these genomes, including predictions of which genes code for missing enzymes in metabolic pathways, and predicted operons. The BioCyc Web site provides a suite of software tools for database searching and visualization, for omics data analysis, and for comparative genomics and comparative pathway questions.
The databases (DBs) within the BioCyc collection are organized into tiers according to the amount of manual review and updating they have received.
Scientists can use the BioCyc Web site to visualize individual metabolic pathways, or to view the complete metabolic map of an organism. The latter diagram can be used to analyze gene expression, proteomics, or metabolomics data using the Omics Viewers, such as to produce animated views of time-course gene-expression experiments. The BioCyc Web site also provides genome browsing capabilities, and for the EcoCyc DB in particular, provides extensive information about transcriptional mechanisms of gene regulation. BioCyc also provides comparative analysis tools (see Tools -> Comparative Analysis in the toolbar).
The navigation capabilities of the Web site allow a user to move from a display of an enzyme to a display of a reaction that the enzyme catalyzes, or to the gene that encodes the enzyme. The interface supports a variety of queries, such as generating a display of the map positions of all genes that code for enzymes within a given biochemical pathway. As well as being used as a reference source to look up individual facts, BioCyc databases support computational studies of the metabolism, such as design of novel biochemical pathways for biotechnology, studies of the evolution of metabolic pathways, and simulation of metabolic pathways.
BioCyc DBs are linked to other biological databases containing protein and nucleic-acid sequence data, bibliographic data, protein structures, and descriptions of different strains.
Pathway Tools Software. The software used to construct, update, visualize, query, and analyze PGDBs, such as the BioCyc collection. Pathway Tools is freely available to academics interested in creating PGDBs for organisms of interest to them.
The contact website address is http://biocyc.org/contact.shtml. The download site for Biocyc is http://biocyc.org/download.shtml.
EcoCyc: Encyclopedia of Escherichia coli Genes and Metabolism
EcoCyc is a scientific database for the bacterium Escherichia coli K-12 MG1655. The EcoCyc project performs literature-based curation of the entire genome, and of transcriptional regulation, transporters, and metabolic pathways. The contact address is http://biocyc.org/support.shtml. EcoCyc is a bioinformatics database that describes the genome and the biochemical machinery of E. coli. The long-term goal of the project is to describe the molecular catalog of the E. coli cell, as well as the functions of each of its molecular parts, to facilitate a system-level understanding of E. coli.
EcoCyc users can search and browse the information in multiple ways. Recent improvements to the EcoCyc Web interface include combined gene/protein pages and a Regulation Summary Diagram displaying a graphical overview of all known regulatory inputs to gene expression and protein activity. The graphical representation of signal transduction pathways has been updated, and the cellular and regulatory overviews were enhanced with new functionality. A specialized undergraduate teaching resource using EcoCyc is being developed.
Because E. coli is the most thoroughly studied bacterium, advances in the understanding of E. coli biology, including the functions of all its genes, are not only of interest to E. coli researchers, but also are helpful for advancing our understanding of less well-studied organisms. Comparative tools are available for the more than 1000 (and growing) databases available in the BioCyc collection (http://biocyc.org), of which EcoCyc is a part. BioCyc tools enable users to navigate the E. coli genome beginning with an orthologous gene in their organism of interest, and to then quickly explore the known functions of the corresponding E. coli genes. High-throughput data can be displayed and analyzed in a larger context�that of the metabolic network, the transcriptional regulatory network, or the entire genome.
Much of the EcoCyc data can now be programmatically retrieved from the EcoCyc web site in XML format using web services. A diverse set of services has been made available to facilitate different types of queries. The following list briefly enumerates the currently available services. Additional services may be added in the future.
� Search for a list of all gene and protein objects whose name contains the query string. For each matching gene or protein, a link to the data page for that object is provided.
� Given a pathway ID, return the pathway data in BioPAX format) (either levels 2 or 3).
� Given an object ID of any kind (such as a gene, protein, compound, reaction or pathway), return the data associated with that object in a format that corresponds closely to that of the underlying Pathway Tools schema. Where the representation of an object references other objects (such as a reaction referencing its substrate compounds), URLs are supplied that enable retrieval of those objects as well.
� Given an arbitrary query constructed using the BioVelo query language, return the data associated with all the matching objects.
Search Options:
EcoCyc now provides multiple search tools that enable searching for specific types of information according to different criteria:
The Quick Search function searches the names of multiple EcoCyc object types (genes, pathways, metabolites, etc.) for terms entered by the user.
Object-Specific searches (such as Search → Genes/Proteins/RNAs) enable the user to define multiple-criteria searches, and then return all objects that match those criteria. For example, the user can search for all genes within a specified base-pair region of the genome, with a specified sequence length and a specified cellular location and that are annotated with specified GO terms.
The Advanced Search function allows the user to specify criteria that span multiple object types (e.g. find all reactions catalyzed by an enzyme with specified properties and containing substrates with specified properties).
The EcoCyc, MetaCyc and BioCyc databases are freely and openly available to all. See http://biocyc.org/download.shtml for download information. New versions of the downloadable data files and of the EcoCyc Web site are released four times per year.
MetaCyc: Metabolic Pathway Database
MetaCyc is a database of nonredundant, experimentally elucidated metabolic pathways. MetaCyc contains more than 1928 pathways from more than 2263 different organisms (circa 2012). The MetaCyc data were curated from more than 36,796 scientific publications. MetaCyc describes metabolic pathways, reactions, enzymes, and metabolites.
MetaCyc is a database of metabolic pathways and enzymes located at http://MetaCyc.org/. Its goal is to serve as a metabolic encyclopedia, containing a collection of non-redundant pathways central to15small molecule metabolism, which have been reported in the experimental literature. Most of the pathways in MetaCyc occur in microorganisms and plants, although animal pathways are also represented. MetaCyc contains metabolic pathways, 20enzymatic reactions, enzymes, chemicalcompounds, genes and review-level comments. Enzyme information includes substrate specificity, kinetic properties, activators, inhibitors, cofactor requirements and links to sequence and structure databases. 25Data are curated from the primary literature by curators with expertise in biochemistry and molecular biology. MetaCyc serves as a readily accessible comprehensive resource on microbial and plant pathways for genome analysis, basic research, edu cation, metabolic engineering and systems biology.
Querying, visualization and curation of the database is supported by SRI�s Pathway Tools software. The
PathoLogic component of Pathway Tools is used in conjunction with MetaCyc to predict the meta3bolic network of an organism from its annotated genome.
A metabolic pathway in MetaCyc consists of reactions, enzymes, metabolites, information on feedback regulation and genes that encode the enzymes for each species. MetaCyc can be searched and browsed using a web browser. Pathways are dynamically generated from the database and graphically displayed with 55 hyperlinks to various pages detailing reactions, enzymes, genes and compounds from MetaCyc, as well as external databases such as Swiss-Prot and PubMed. It, therefore, serves as a readily accessible source of up-to-date, literature-curated information on metabolic pathways and enzymes to research ers for use in basic research and genome analysis, and to students and teachers for educational purposes. In addition, MetaCyc, in conjunction with the Pathway Tools software , can be used to predict metabolic networks from a list of annotated sequences resulting from genome or transcript sequencing . Those predicted networks can provide a knowledge framework onto which reaction flux models can be built.
MetaCyc is freely available via the Web at http://Metacyc.org/ (updated four times a year). It is also available for download, free of charge to non-profit organizations or for a fee to commercial institutions, as a stand-alone application program for Linux, Windows and Solaris workstations (updated two times a year). A set of flat data files that is updated four times a year 75 is also available online at http://BioCyc.org/download.shtml.
The Pathway Tools software provides query and visualization services to users and editing functions to curators. Recent enhancements to the software that are relevant to MetaCyc users include the following:
Improved displays: The pathway display algorithms have been modified to produce more compact pathway diagrams 15 that are more likely to fit within a single page.
Enzyme/gene naming: Protein and gene names within a pathway display are now labeled with the initials of an organism�s genus and species name (e.g. an Escherichia coli enzyme and gene are written as �acetylornithine decarboxylase (Ec)� and �Ec-argD�, respectively). This notation aids in identifying individual proteins and genes from multiple organisms that are assigned to the same pathway.
Chemical drawing tools: The Pathway Tools software now includes interfaces for both the Marvin (http://www.chemaxon.com/marvin/) and JME (http://www.molinspiration.com/jme/) chemical drawing editors, permitting the user to enter or modify chemical structures within MetaCyc or other PGDBs.
A new suite of comparative genomics tools is available in Pathway Tools in conjunction with the preceding expansion of the BioCyc database collection (see below). These tools include comparisons of the full pathway, reaction and metabolite sets present in a specified group of organisms; comparisons of genes associated with a single pathway or a single reaction across a specified group of organisms, including the operon distributions of those genes; and a comparative genome browser for visualizing chromosomal regions around a specified set of orthologous genes.
SPECIALIZED DATABASE (IMGT, REBASE, COG, LIGAND, BRENDA)
IMGT:
IMGT is a high-quality integrated knowledge resource specialized in the immunoglobulins or antibodies, T cell receptors, major histocompatibility complex, of human and other vertebrate species, proteins of the IgSF and MhcSF, and related proteins of the immune systems of any species. It was created in 1989 by Marie-Paule Lefranc, Laboratoire d�ImmunoGe� ne� tique Mole� culaire LIGM (Universite�Montpellier 2 and CNRS) at Montpellier, France, in order to standardize and manage the complexity of immunogenetics data. The website address was http://www.imgt.org.
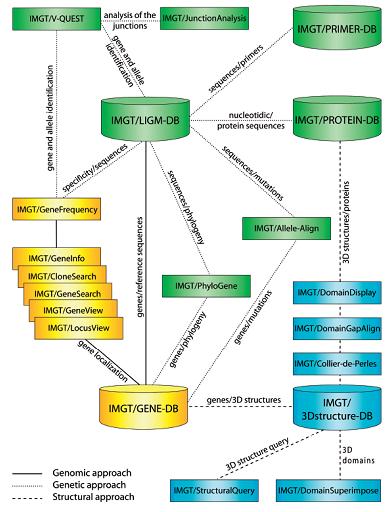
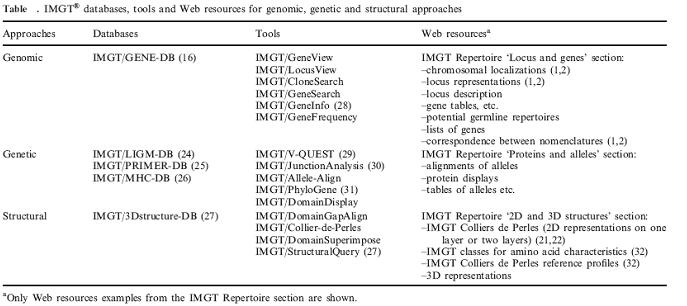
The IMGT information system consists of databases, tools and Web resources. IMGT_ provides a common access to standardized data from genome, proteome, genetics and 3D structures. IMGT_ consists of five databases (IMGT/ LIGM-DB, IMGT/GENE-DB, IMGT/3Dstructure-DB, etc.), fifteen interactive online tools for sequence, genome and 3D structure analysis, and more than 10 000 HTML pages of synthesis and knowledge. IMGT_ is used in medical research (autoimmune diseases, infectious diseases, AIDS, leukemias, lymphomas and myelomas), veterinary research, biotechnology related to antibody engineering (phage displays, combinatorial libraries, chimeric, humanized and human antibodies), diagnostics (clonalities, detection and follow-up of residual diseases) and therapeutical approaches (graft, immunotherapy, vaccinology).
IMGT has reached that goal through the building of a unique ontology, IMGT-ONTOLOGY, the first ontology in immunogenetics and immunoinformatics. IMGTONTOLOGY has allowed the setting up of the official nomenclature of the IG and TR genes and alleles, the definition of IMGT standardized labels, and the IMGT unique numbering that bridges the gap between sequences and 3D structures for the variable (V) and constant (C) domains of the IG and TR and for the groove (G) domains of the major histocompatibility complex (MHC).
FTP site: ftp://imgt.cines.fr/IMGT
Contact: denys.chaume@igh.cnrs.fr Marie-Paule.Lefranc@igh.cnrs.fr
CNRS : Centre national de la recherche scientifique
LIGM � Laboratory of Immunogentic Molecularbiology
IMGT/GENE-DB is the comprehensive IMGT_genome database. IMGT/GENE-DB is the official repository of all the IG and TR genes and alleles approved by the World Health Organization (WHO)/International Union of Immunological Societies (IUIS) Nomenclature Subcommittee for IG and TR. In September 2008, IMGT/GENE-DB contained 1911 IG and TR genes from human, mouse and rat and 2909 alleles.
IMGT/LIGM-DB is the comprehensive IMGT_ database of IG and TR nucleotide sequences from human and other vertebrate species, with translation for fully annotated sequences, created in 1989 by LIGM, Montpellier, France, on the Web since July 1995. IMGT/LIGM-DB is the first and the largest IMGT_ database. In September 2008, IMGT/LIGM-DB contained 126 667 nucleotide sequences of IG and TR from 223 vertebrate species. The unique source of data for IMGT/LIGM-DB is EMBL-Bank which shares data with the other two generalist databases GenBank and DDBJ.
IMGT/3Dstructure-DB is the IMGT_ 3D structure database, created by LIGM, on the Web since November 2001. IMGT/3Dstructure-DB comprises IG, TR, MHC, IgSF, MhcSF and RPI with known 3D structures. In September 2008, IMGT/3Dstructure-DB contained 1461 atomic coordinate files. These coordinate files extracted from the Protein Data Bank (PDB) are renumbered according to the standardized IMGT unique numbering.
Tools
The IMGT_ gene tools (genomic approach) manage the locus organization and gene location and provide the display of physical maps for the human and mouse IG, TR and MHC loci. They allow to view genes in a locus (IMGT/GeneView, IMGT/LocusView), to search for clones (IMGT/CloneSearch), or to search for genes in a locus (IMGT/GeneSearch, IMGT/GeneInfo) based on IMGT_ gene names, functionality or localization on the chromosome.
The IMGT_ sequence analysis tools (genetic approach) comprise IMGT/V-QUEST (29) for the identification of the V, D and J genes and of their mutations, IMGT/ JunctionAnalysis (30) for the analysis of the V-J and V-D-J junctions that confer the antigen receptor specificity, IMGT/Allele-Align for the detection of polymorphisms, IMGT/Phylogene (31) for gene evolution analyses, and IMGT/DomainDisplay for the display of amino acid sequences from the IMGT domain directory.
The IMGT_ structure tools bridge the gap between sequences and 3D structures: IMGT/DomainGapAlign analyses amino acid sequences per domain, IMGT/ Collier-de-Perles allows to make your own IMGT Collier de Perles, and IMGT/DomainSuperimpose allows to superimpose two domain 3D structures from IMGT/3Dstructure-DB.
IMGT_ is used in very diverse domains: (i) fundamental and medical research (repertoire analysis of the IG antibody recognition sites and of the TR recognition sites in normal and pathological situations such as autoimmune diseases, infectious diseases, AIDS, leukemias, lymphomas
and myelomas); (ii) veterinary research (IG and TR repertoires in farm and wild life species); (iii) genome diversity and genome evolution studies of the adaptive immune responses; (iv) structural evolution of the IgSF and MhcSF proteins; (v) biotechnology related to antibody engineering (single chain Fragment variable (scFv), phage displays, combinatorial libraries, chimeric, humanized and human antibodies); (vi) diagnostics (clonalities, detection and follow-up of residual diseases) and (vii) therapeutical approaches (grafts, immunotherapy and vaccinology). IMGT monthly updated.
REBASE:
It was maintained by Dr. Richard J. Roberts and Dana Macelis. It was located at New England Biolabs, Inc., 240 County Road, Ipswich, MA 01938, USA. REBASE is a comprehensive database of information about restriction enzymes, DNA methyltransferases and related proteins involved in restriction�modification. It contains both published and unpublishedwork with information about recognition and cleavage sites, isoschizomers, commercial availability, crystal and sequence data. Experimentally characterized homing endonucleases are also included. Additionally, REBASE contains complete and up-to-date information about the methylation sensitivity of restriction endonucleases. An extensive analysis is included of therestriction�modificationsystemsthatarepredicted to be present in the sequenced bacterial and archaeal genomes fromGenBank.
REBASE includes links to Gen-Bank and PubMed, and NCBI�s Linkout utility uses REBASE, PubMed and GenBank record numbers to hook directly into REBASE�s enzyme, sequence, reference and genome data. Links to other major databases such as SwissProt, PDB and PFam are also maintained. There are currently 3945 biochemically characterized restriction enzymes in REBASE and of the 3834 Type II restriction enzymes, 641 are commercially available, including 235 distinct specificities from a total of 299 total specificities known.
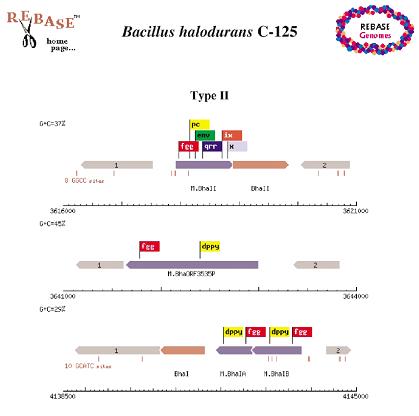
The REBASE Genomes Icon leads to data for the currently sequenced 193 bacterial and 21 archaeal genomes. Schematic representations of the whole genomes and the individual RM (Restriction Modification) system within them are available and, from the pages showing the sequence schematics, there are links to the major database entries for these genes as well as links that will identify the closest neighboring sequences.
REBASE tools include REBsites, BLAST against REBASE, NEB cutter, and REBpredictor. REBASE Links like REBASE News, REBASE suppliers, REBASE enzymes etc.,.
The REBASE website (http://rebase.neb.com/rebase/rebase.html) summarizes all information known about every restriction enzyme and their associated proteins. The ftp site is ftp.neb.com. REBASE is updated daily and is constantly expanding.
COG:
Clusters of Orthologous Groups of proteins (COGs) were delineated by comparing protein sequences encoded in complete genomes, representing major phylogenetic lineages. Each COG consists of individual proteins or groups of paralogs from at least 3 lineages and thus corresponds to an ancient conserved domain. 66 genomes, 38 orders, 28 classes, and 14 phyla are present in cog. It was created by Roman L. Tatusov. It was maintained by NCBI.
COGs have been identified on the basis of an all-against-all sequence comparison of the proteins encoded in complete genomes using the gapped BLAST program after masking low complexicity and predicted coiledcoil regions. The cog construction procedure is based on the simple notion that any group of at least three proteins from distant genomes that are more similar to each other than they are to any other proteins from the same genomes ae most likely to belong to an orthologous family. This prediction holds even if the absolute level of sequence similarity between the proteins in question is relatively low and thus the cog approach accommodates both slow-evolving and fast-evolving genes.
Briefly, COG construction includes the following steps:
The COG collection currently consists of 138,458 proteins, which form 4873 COGs and comprise 75% of the 185,505 (predicted) proteins encoded in 66 genomes of unicellular organisms. The eukaryotic orthologous groups (KOGs) include proteins from 7 eukaryotic genomes: three animals (the nematode Caenorhabditis elegans, the fruit fly Drosophila melanogaster and Homo sapiens), one plant, Arabidopsis thaliana, two fungi (Saccharomyces cerevisiae and Schizosaccharomyces pombe), and the intracellular microsporidian parasite Encephalitozoon cuniculi. The current KOG set consists of 4852 clusters of orthologs, which include 59,838 proteins, or ~54% of the analyzed eukaryotic 110,655 gene products. Compared to the coverage of the prokaryotic genomes with COGs, a considerably smaller fraction of eukaryotic genes could be included into the KOGs; addition of new eukaryotic genomes is expected to result in substantial increase in the coverage of eukaryotic genomes with KOGs. Examination of the phyletic patterns of KOGs reveals a conserved core represented in all analyzed species and consisting of ~20% of the KOG set. This conserved portion of the KOG set is much greater than the ubiquitous portion of the COG set (~1% of the COGs). In part, this difference is probably due to the small number of included eukaryotic genomes, but it could also reflect the relative compactness of eukaryotes as a clade and the greater evolutionary stability of eukaryotic genomes.
The COG system, which includes the COGNITOR program for adding new members to COGs (RLT, unpublished results), has become a widely used tool for computational genomics. The most important applications of the COGs are functional annotation of newly sequenced genomesand genome-wide evolutionary analyses. COG page was linked to BLAST, ClustalW and Entrez genome.
Website: http://www.ncbi.nlm.nih.gov/COG/
Contact: info@ncbi.nlm.nih.gov
ftp at ftp://ftp.ncbi.nih.gov/pub/COG/.
LIGAND:
Website: http://www.genome.jp/dbget/ligand.html
KEGG LIGAND contains our knowledge on the universe of chemical substances and reactions that are relevant to life. It is a composite database consisting of COMPOUND, GLYCAN, REACTION, RPAIR, RCLASS, and ENZYME databases, whose entries are identified by C, G, R, RP, RC, and EC numbers, respectively. ENZYME is derived from the IUBMB/IUPAC Enzyme Nomenclature, but the others are internally developed and maintained. The primary database of KEGG LIGAND is a relational database with the KegDraw interface, which is used to generated the secondary (flat file) database for DBGET. A read-only copy of the LIGAND relational database is made publicly accessible.
The KEGG LIGAND database contains information about chemical structures and chemical reactions of endogenous molecules, small molecules to larger biopolymers. Certain KEGG pathway maps contain reference chemical structures that can be used to link genomes to the chemical diversity of endogenous molecules. For example, the KEGG pathway map for N-glycan biosynthesis (map00510) contains both the biosynthetic pathway and the synthesized glycan structure. By mapping the genomic content of glycosyltransferases, such as for human (hsa00510), the organism-specific pathway and the organism-specific glycan structure can be seen. This type of structural mapping has been done more extensively in eukaryotic genomes to characterize the chemical structural diversity of glycans (11) and lipids (12). A potentially more interesting, but more difficult, problem is to link plant genomes to plant secondary metabolites. Plants are known to produce diverse chemical compounds including those with medicinal and nutritional values, but the chemical architecture is more complex than simple biopolymers of glycans and lipids.
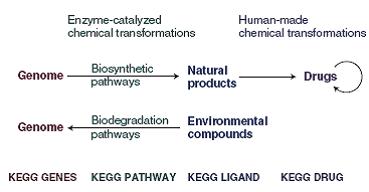
Originally, the LIGAND database consisted of just two components: ENZYME for enzyme nomenclature and COMPOUND for chemical compound structures (6). It later successively included additional components: REACTION for chemical reaction formulas, GLYCAN for glycan structures, RPAIR for reactant pair transformation patterns and DRUG for drug information. This expansion of the LIGAND collection represents our expanded efforts for understanding the chemical space that is part of the biological world. The KEGG DRUG database is a new addition from KEGG release 36.1 (December 2005). It contains chemical structures and additional information such as therapeutic categories and target molecules. A most unique feature of KEGG DRUG is a collection of drug structure maps, which graphically illustrate, in a manner similar to KEGG pathway maps, our knowledge on groups of chemical structural patterns, therapeutic categories, their relationships and the chronology of drug development if known.
Reaction classification
The RC system in the chemical space is a counterpart of the KO system in the genomic space (Figure 1). It represents our attempt to organize knowledge on chemical reactions by 85 categorizing chemical structure transformation patterns. The REACTION database contains individual reaction formulas taken from the ENZYME database. Each reaction formula is split into a set of substrate-product pairs, and the chemical structure comparison program SIMCOMP is applied to obtain 90 an optimal alignment. This comparison is based on atom typing, which is the conversion of regular atomic (C, N, O, S, P and so on) representation to what we call KCF representation that consists of 68 atom types distinguishing functional groups and atomic environments (7). The chemical structure alignment generated by SIMCOMP is used to define the R atom for the reaction center, the D atom(s) for adjacent atom(s) in the mismatched region and the M atom(s) for adjacent atom(s) in the matched region (8). This is first done computationally and is followed by extensive manual curation. 100 The RPAIR database is still under development, but it is the basis for the RC system categorizing curated RDM patterns. Since an enzymatic reaction usually involves multiple substrates and products, one EC number corresponds to a combination of RDM patterns. The RC system has enabled automatic assignment of EC numbers from a set of substrate and product structures (8) and will further enable exploration of unknown reactions by generating plausible combinations of RDM patterns, which may then be related to possible paralogs of enzyme genes. 110
Glycosyltransferase reactions
Functional glycomics has been a most successful area for integrated analysis of genomic and chemical information . The carbohydrate sequence of glycans is determined by a specific set of biosynthetic reactions catalyzed by different types of glycosyltransferases. Thus, once we know the repertoire
of glycosyltransferases in the genome or in the transcriptome, it should in principle be possible to predict the repertoire of glycan structures. Conversely, the knowledge about glycan structures can be used to search and annotate new glycosyltransferases. Composite Structure Map in KEGG GLYCAN is a tool for converting genomic or transcriptomic data to glycan structure variations based on a curated set of known glycosyltransferase reactions.
Contact: kanehisa@kuicr.kyoto-u.ac.jp
ftp: ftp://kegg..genome.ad.jp/molecules/ligand/
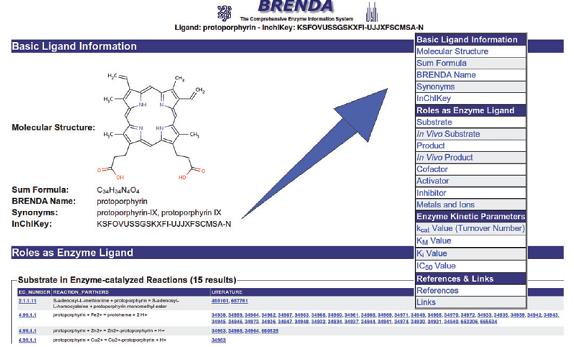
BRENDA:
BRENDA (BRaunschweig ENzyme DAtabase) is the main repository of manually annotated enzyme data. The development of the database began in 1987 at the former German National Research GBF (now: Helmholtz Centre for Infection Research) in Braunschweig. Initially, the enzyme data were published as a series of books (Handbook of Enzymes, Springer, 1). The data were continuously curated and improved at the University of Cologne (Institute for Biochemistry) from 1996 to 2007. In this period, the database was transformed into a publicly available database and subsequently converted from a fulltext into a relational database system. Since 2007, BRENDA is maintained and curated at the Technische Universita� t Braunschweig, Institute for Bioinformatics & Systems Biology.
An elaborate query engine provides access to all data stored in the tables of the relational database. The �Quick search� option allows a simple search in one of the 56 data fields. More sophisticated queries can be performed using the �Advanced Search� by combining up to 20 search categories for text or numerical data fields. The 2009 newly introduced �Protein Search� offers a quick access to the protein-specific data in BRENDA. The �Fulltext Search� option provides a search in all tables in BRENDA, including the �Commentary� field. The �Substructure Search� allows the display of enzyme� ligand interactions.
Summarized over all information fields BRENDA contains about 3.2 million data manually extracted from the primary literature, each connected with the respective enzyme, the source organism and a literature reference. The database covers all enzyme classes that have been classified by the IUBMB (The International Union of Biochemistry and Molecular Biology). More than 100 000 references were manually annotated resulting in an average of more than 660 single data entries for each EC class. Enzymes from 10 500 different organisms are characterized. Because enzymes frequently are not referred to by their proper recommended names issued by the IUBMB, BRENDA aims at storing complete lists of synonyms. On average, each enzyme has 15 synonymous denominations.
Enzyme-catalysed reactions are one of the core areas of the database, with approximately 79 000 different reactions including approximately 13 000 in vivo reactions. More than 300 000 functional and kinetic parameters such as KM-values, turnover numbers and inhibition constants are stored. Since the last publication in 2009 the number of manually annotated references increased by 30% to more than 100 000. About 169 new enzyme classes, classified by IUBMB enzyme committee in 2009 and 2010, are included. BRENDA is not restricted to a specific organism or to specific aspects in biochemistry or molecular biology, but covers a wide range of functional information: classification and nomenclature, reaction and specificity, isolation and preparation, stability and enzyme structure, functional and kinetic parameters, organism-related information, enzyme-related disease information, application and data of mutant and engineered enzymes. Table 1 gives an overview on the data content of selected data fields. BRENDA provides information about diseases connected to anomalous enzyme function. A modified co-occurrence based text mining procedure is used for the extraction of these data from PubMed abstracts. In release 2009.2 the new text mining method yielded 745 650 distinct entries (enzyme-disease-reference) which increased by 22% to 910 897 entries in 2010.2.
With the huge amount of enzyme data stored in BRENDA, it is ideally suited for model building within systems biology projects where pathways are constructed by substrate/product chains and kinetic parameters without an experimentally determined value are often estimated by elaborated procedures. In the future, BRENDA will provide tools that will strongly enhance the data access for such projects. In addition the high-quality manually extracted data will increasingly be complemented by clearly identified data obtained by text-mining approaches. Besides that, additional information fields, like information on enzyme expression, or the second order rate constant kcat/KM will be included in the data. The BRENDA team is also actively involved in the STRENDA initiative that provides standards for good practice in the publication of enzyme data.
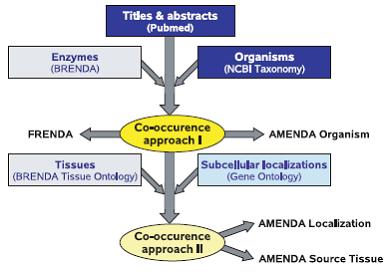
In addition to the manually annotated data, two databases FRENDA (Full Reference ENzyme DAta) and AMENDA (Automatic Mining of ENzyme DAta) are maintained based on text-mining procedures, which are continuously improved to increase the quality and to reduce the number of false-positive entries.
The number of manually annotated references increased by 30% to more than 100 000, the number of ligand structures by 45% to almost 100 000. New query, analysis and data management tools were implemented to improve data processing, data presentation, data input and data access. BRENDA now provides new viewing options such as the display of the statistics of functional parameters and the 3D view of protein sequence and structure features. Furthermore a ligand summary shows comprehensive information on the BRENDA ligands. The enzymes are linked to their respective pathways and can be viewed in pathway maps. The disease text mining part is strongly enhanced. It is possible to submit new, not yet classified enzymes to BRENDA, which then are reviewed and classified by the International Union of Biochemistry and Molecular Biology. A new SBML output format of BRENDA kinetic data allows the construction of organism-specific metabolic models.
Download: http://www.brendaenzymes.org/brenda_download/index.php
Contact : d.schomburg@tu-bs.de
Systems Biology Markup Language (SBML)
PROTEIN STRUCTURE DATABASES
In biology, a protein structure database is a database that is modeled around the various experimentally determined protein structures. The aim of most protein structure databases is to organize and annotate the protein structures, providing the biological community access to the experimental data in a useful way. Data included in protein structure databases often includes three dimensional coordinates as well as experimental information, such as unit cell dimensions and angles for x-ray crystallography determined structures. Though most instances, in this case either proteins or a specific structure determinations of a protein, also contain sequence information and some databases even provide means for performing sequence based queries, the primary attribute of a structure database is structural information, whereas sequence databases focus on sequence information, and contain no structural information for the majority of entries. Protein structure databases are critical for many efforts in computational biology such as structure based drug design, both in developing the computational methods used and in providing a large experimental dataset used by some methods to provide insights about the function of a protein.
PROTEIN DATA BANK (PDB):
Website: http://www.pdb.org
The PDB archive contains information about experimentally-determined structures of proteins, nucleic acids, and complex assemblies. As a member of the wwPDB, the RCSB PDB curates and annotates PDB data according to agreed upon standards. Use the RCSB PDB to perform simple and advanced searches based on annotations relating to sequence, structure and function, and to visualize, download, and analyze molecules.
The RCSB Protein Data Bank (RCSB PDB) provides access to the data in the PDB, the single archive of experimentally determined structures of nucleic acids, proteins and complex assemblies. The public archive currently contains >84 000 entries, derived data files and related data dictionaries. With >570 000 files, the PDB requires >130 GB of storage space. Data are updated weekly and loaded into the relational database that supports the web site.
PDB data can be searched in many different ways. The top menu bar can be used to perform simple searches, including author name, molecule name, sequence or ligand ID. �Advanced Search� can be used to build queries with multiple constraints, such as �find all protein homodimers bound to DNA�. The �Browse Database� option allows exploration of the PDB archive using different hierarchical trees. Browsers are available to search for related terms and structures based on many different classifications, such as Biological Process, Cellular Component, Molecular Function, Enzyme Commission number, Transporter Classification System, and structure classifications SCOP and CATH. Data distribution summaries, shown as pie charts and lists of hyperlinks, are available for standard features of PDB entries (resolution, release date, experimental method, polymer type, organism and taxonomy). These drill-down distributions provide another way to browse and select data from the whole archive or any search results.
PDB at Mobile:
A simplified interface to the RCSB PDB is available as an app for the iPhone/iPod and the iPad. The app offers special features, including a simplified search for macromolecule name, author name and PDB ID. Query results, displayed in a single page listing, can be filtered by author name, title and organism. A macromolecule image and the PubMed abstract (when available) for individual entries are displayed when the user selects an entry from a returned query results list.
PDB submission:
The wwPDB now accepts polypeptide structure depositions of all gene products; all naturally-occuring, non-ribosomally synthesized peptides, such as antibiotics; and all peptidic repeat units of larger polymers, such as fibrous and amyloid polymers. In addition, non-naturally occurring synthetic peptides with at least 24 residues will be accepted for deposition. Consistent with earlier policy, depositions of polynucleotide and polysaccharide structures of 4 or more residues are also accepted. PDB entries are processed by the members of the wwPDB (RCSB, PDBe and PDBj). They are either released when the corresponding paper is published (HPUB), released on a particular date (HOLD), or released immediately (REL). Each week, all files scheduled for release or modification are checked and validated one final time. Authors may be contacted to resolve any issues that may arise while preparing the entries for release. When the release of HPUB structures is requested, the PDB staff routinely confirms the primary citation. If this is not accomplished within that release cycle, the entry may be scheduled to be released in a later update. Each wwPDB member has tools for depositing data to the PDB archive.To deposit your X-ray or EM structures with the RCSB PDB, use our ADIT deposition tool. To deposit your NMR structures to the RCSB PDB/BMRB, use our ADIT-NMR tool.
Tools:
Visualization tool
Protein Workshop is one of several 3D molecular viewers offered from the RCSB PDB web site. It offers quick default styles and views, with additional appearance options. Chains and atoms can be selected by either clicking on the structure or molecules displayed as a tree.
Download services
Download service was used to download single or more files using their IDs.
http://www.pdb.org/pdb/download/download.do
Structure comparison
Sequence and structure alignments are standard methods for analyzing the evolutionary and functional relationship between proteins. The Protein Comparison Tool offers a number of sequence and structure alignment algorithms for a detailed analysis of pairwise relationships.
http://www.pdb.org/pdb/workbench/workbench.do
File formats:
Structures are available in different formats namely PDB, mmCIF, XML format and chemical component dictionary.
http://www.pdb.org/pdb/static.do?p=file_formats/index.jsp
Widget
The RCSB PDB provides web widgets, small bits of code, which provide PDB functionality that you can embed in your own website. All of the widgets are 100% self contained JavaScript files. They are comparison tool widget, molecule of the month widget, tag library and image libray.
http://www.pdb.org/pdb/static.do?p=widgets/widgetShowcase.jsp
RESTful service
The RCSB PDB supports RESTful (REpresentational State Transfer) Web Services to make accessing data easier. Please use these services instead of screen-scraping. Generally we are trying to implement two types of services for our RESTful interface: Search services: to return a list of IDs (e.g., PDB IDs, chain IDs, ligand IDs) and Fetch services: to return data given a ID (e.g. reports, descriptions, data items)
Download site: ftp://ftp.wwpdb.org/
Deposit: deposit@deposit.rcsb.org
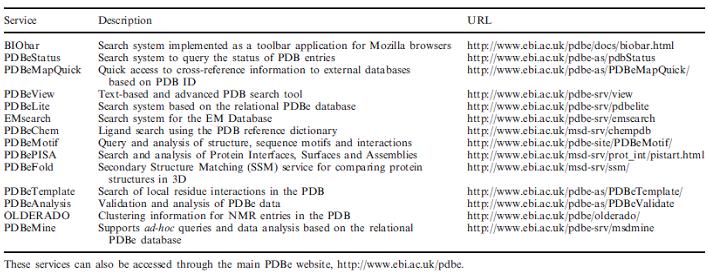
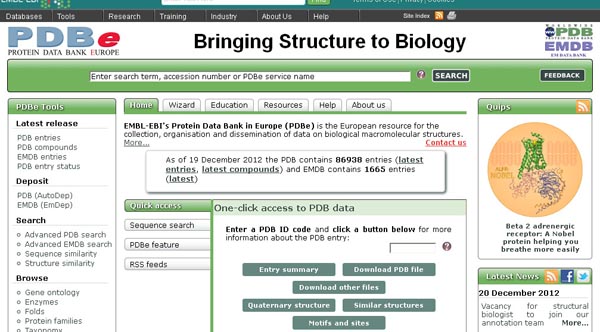
MSD (MACROMOLECULAR STRUCTURAL DATABASE) OR PDBE:
The Protein Data Bank in Europe [PDBe; previously known as the Macromolecular Structure Database, MSD], the Research Collaboratory for Structural Bioinformatics (RCSB) and the BioMagResBank (BMRB) in the USA, and the Protein Data Bank Japan (PDBj), collectively form the Worldwide Protein Data Bank (wwPDB) organization. wwPDB is responsible for maintaining the single worldwide repository of bio-macromolecular structure data, the Protein Data Bank (PDB).
The MSD group has changed its name to the PDBe to reflect its close partnership with the wwPDB project. The services and tools will change their names to reflect this change but we will maintain all existing URL's to maintain external references to the MSD resource. The new website address is http://www.ebi.ac.uk/msd/.
The main objectives of the work at PDBe are:
PDBe is actively working with the X-ray crystallography, Nuclear Magnetic Resonance (NMR) spectroscopy and cryo-Electron Microscopy (EM) communities. To keep abreast of new developments in the NMR community, PDBe collaborates with BMRB, has participated in EU projects (eNMR and until recently Extend-NMR), and continues to contribute to the Collaborative Computational Project for the NMR community (CCPN), which aims to provide a standard model, related libraries, reference data) and applications) for storage and handling of NMR data. PDBe�s commitment to the field of cryo-EM dates back to 2002 when the Electron Microscopy Data Bank (EMDB) was established at the EBI. Originally funded through the EU-funded Network of Excellence for �Three-Dimensional Electron Microscopy�, EMDB is now developed and operated jointly with RCSB and Baylor College of Medicine with National Institutes of Health (NIH) funding. Recently, EMDB has also received UK funding for a collaborative project with the Open Microscopy Environment developed at the University of Dundee.
AutoDep version 4 (http://www.ebi.ac.uk/pdbe-xdep/autodep/) is a service provided by PDBe to facilitate deposition of coordinate and experimental data into the PDB. The current release of AutoDep (4.3) contains significant improvements over previous releases of AutoDep 4 and the original AutoDep system, written at BNL in the 1990s. The results of the search are updated weekly and returned as a dynamic RSS feed.
Tools:
Contact: pdbhelp@ebi.ac.uk
MMDB (http://www.ncbi.nlm.nih.gov/Structure/MMDB/mmdb.shtml):
The Molecular Modeling DataBase (MMDB) is a database of experimentally determined three-dimensional biomolecular structures, and is also referred to as the Entrez Structure database. It is a subset of three-dimensional structures obtained from the RCSB Protein Data Bank (PDB), excluding theoretical models. The data processing procedure at NCBI results in the addition of a number of useful features that facilitate computation on the data and link them to many other data types in the Entrez system.
Each MMDB record cross-references the source PDB record from which it was
derived (i.e., the MMDB summary page for a structure displays both its MMDB ID
and the corresponding PDB ID). If an MMDB record represents a structure that was
merged from two or more PDB split files, then the summary page will show the PDB
IDs of all the source PDB records that compose the merged structure.
MMDB contains various record types, reflecting various experimental methodologies such as X-ray crystallography and Nuclear Magnetic Resonance (NMR), and various molecule types such as proteins, DNA, and RNA, with or without bound chemicals. The content of an individual structure record reflects the data provided by the submitter, and the literature associated with a structure record provides more details about it. Note that various data submitters might use different terminology to describe the same gene or protein (for example, some might use the term "suppressor" while others use the term "inhibitor"), so it is often helpful to include synonyms, such as acronyms, full spellings, and disease names, if appropriate, when searching the database.
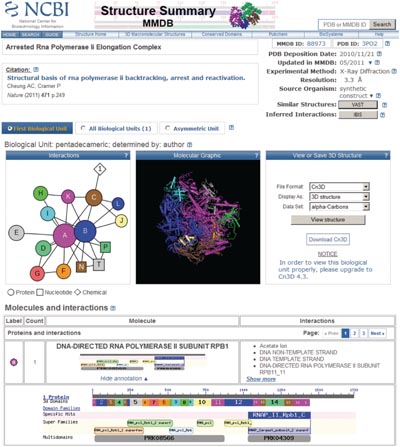
3D structures of biological units may be visualized using the 3D viewer Cn3D, which has recently been released as a new version v4.3, to support visualization of biological units with macromolecules generated via symmetry operations. Cn3D v4.3 also comes with a wider range of features, such as side-by-side stereo, and is distributed as a helper application for the web-browser. 3D structures may also be visualized using any viewer that works with PDB file format, such as RasMol and its derivatives.
CBLAST is a web service that visualizes similarities between proteins in NCBI's Entrez database [or arbitrary proteins submitted to NCBI's BLAST service] and those with known 3D structures tracked in MMDB. It provides lists of homologous 3D structures for protein records in Entrez, as well as alignment details and visualization of sequence-structure alignments via the Cn3D viewer.
NCBI continues to pre-compute results for all-against-all structure neighboring tethered to MMDB, using the VAST algorithm. For analysis of structural similarities, protein 3D structures are parsed geometrically to reveal structurally compact subdomains. The search for structure neighbors is performed for such subdomains as well as for the whole molecule. Structurally compact subdomains, when present, are indicated in sequence annotation views as provided by the structure summary pages and labeled �3d Domains�.
MMDB is updated once a week, in synchrony with the PDB. The update and computation of new and additional structure neighbors usually takes no more than 2 or 3 days to complete, depending on the size of the update and the nature of the newly added structures. Currently, MMDB holds 75800 entries, more than half of which represent molecular complexes with two or more macromolecules.
Researchers who wish to use the MMDB and VAST neighbor data in their own calculations may download them directly via FTP at: ftp://ncbi.nlm.nih.gov/mmdb/ . Comments, suggestions and questions are welcome and should be addressed to: info@ncbi.nlm.nih.gov.